Trend trading is a style of trading that is based on an analysis of the historical price moves of an asset. Learn exactly what trend trading is, how it works, and some trend trading strategies that beginner investors could consider implementing.
Trends occur when the price of an asset consistently moves in one direction. This move can either be bullish or bearish, or the price of an asset could move sideways. The longer a trend is sustained, the greater extent to which it is considered “confirmed,” and the more likely it is that trend traders will open a position.

What is trend trading?
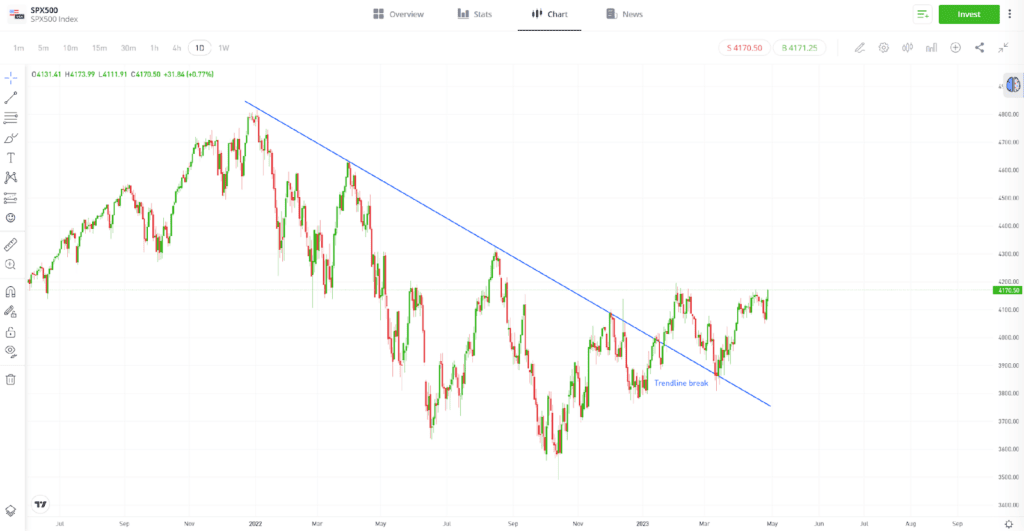
Trend trading works on the assumption that momentum will result in the price of an asset continuing to move in the direction of an existing trend. After establishing the direction in which the price of an asset is heading, trend traders take positions in the same direction. It is a common assumption in trading and investing that an upward price move will result in a downward one. Although this happens often, it is not always the case.
For example, historical data demonstrates that the long-term price trend of the stock market is upwards. Despite the ups and downs, some buy-and-hold investors believe that this overarching trend will continue.
Analysis of trends typically involves looking at price charts and other features of technical analysis to determine which direction the price is heading.

Past performance is not an indication of future results
Source: eToro
How does trend trading work?

Trend trading strategies can be applied in any market and in any time frame. For example, day traders might take a position on a forex trend that lasts for minutes or hours, whereas other investors might try and identify trends in stocks that last for months or years.
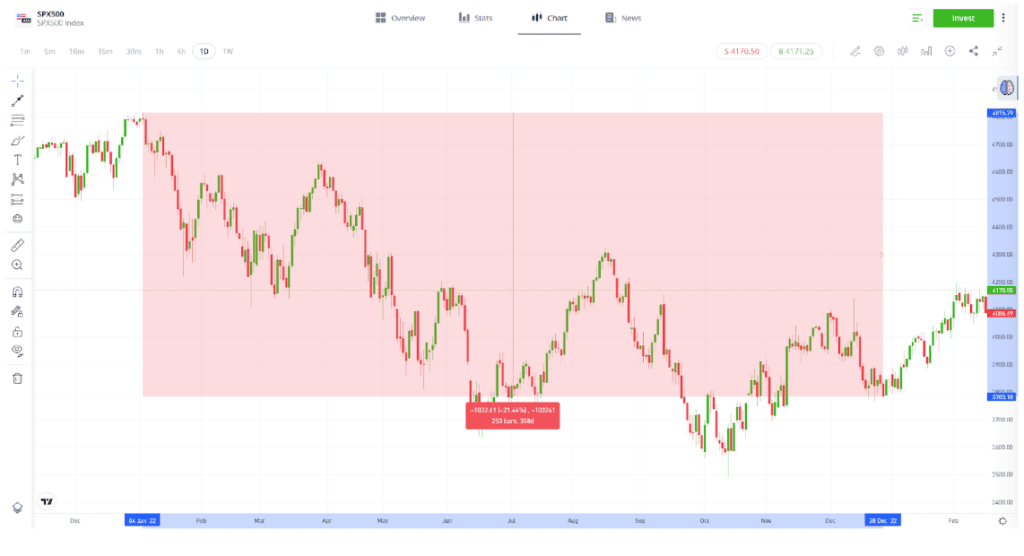
It is important to establish the time frame in which you want your strategy to operate. For example, the long-term trend in the S&P 500 Index has been upwards, but the price trend in 2022 specifically was downwards. Long-term trend traders would have been better off opening a long position, whereas trend traders in 2022 would have had better results selling short.

Past performance is not an indication of future results
Source: eToro
Price moves in the opposite direction to an underlying trend are called retracements. For trend traders, it is important to determine whether these retracements are temporary or if they signal the start of a new, longer term trend reversal taking place.
Tip: Technical analysis can help to identify trends, but fundamental analysis will often play a role in determining whether the trend will continue.
Trend trading relies largely on charting, technical analysis and historical price data. However, changes in trend direction are often a result of real-world events that cannot be predicted by price charts. These events could occur as a result of natural disasters or changes in the geopolitical situation, for example.
| Trading Tool | Purpose |
|---|---|
| Buy trade / Long position | To take a position that would be profitable in an upward trend |
| Sell trade / Short position | To take a position that would be profitable in a downward trend |
| Stop-loss | An automated instruction to close out a percentage of a position at a certain price level, to limit losses |
| Trailing stop-loss | A stop-loss that tracks the price of an asset when it moves in your favour, but not when it moves against you |
| Take-profit | An automated instruction to buy or sell an open position for a profit |
Trend trading strategies
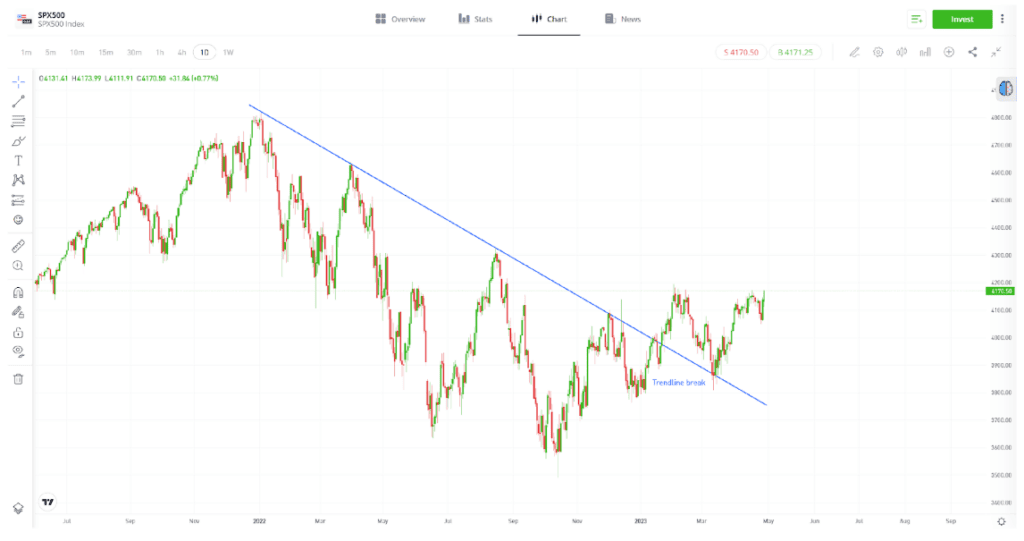
There are various tools that can be used to help establish whether a trend is likely to continue or not. For example, drawing a trendline can give a visual representation of the direction of price action. It also pinpoints price levels at which a trendline break would suggest a trend has ended.
The greater the number of indicators that are aligned, the stronger the overall signal that a trend has been formed.

Past performance is not an indication of future results
Source: eToro
There are other indicators that consider different types of data. For example, the On-Balance Volume (OBV) indicator considers trading activity, as well as price action. In theory, the greater the number of active traders, the stronger the signal.
| Trend Trading Indicator | Description | Use |
|---|---|---|
| Charting | Charts show the price of an asset over time to help develop a visual understanding of price action. | Can help traders identify price patterns. Because of the popularity of charting, a chart-based trading signal can lead to a significant number of traders putting on positions at the same time. |
| Moving Averages (MA) | Technical indicators that combine the price points of an asset over a specified time frame, divided by the number of data points. | Smooths out price data, producing a single line that can help traders identify trends. |
| Relative Strength Index (RSI) | A momentum indicator that measures the magnitude of recent price changes to analyse overbought or oversold conditions. | Momentum indicators can tell you how strong a trend is and whether a reversal is likely to occur. |
| Bollinger Bands | A volatility indicator that uses standard deviation to measure the extent to which the price of an asset might diverge from a longer term moving average. | Volatility indicators tell you the rate at which price is changing in a given period. |
| Money Flow Index | A volume indicator that is based on RSI, but factors in the levels of trading activity as well as price data. | Volume indicators allow traders to take a view on how strong a price move is. |
It is possible that different trend indicators will give off contrasting signals at the same time. Learning which indicators to apply to certain market conditions is a crucial part of trend trading. Generally speaking, the greater the number of indicators that are aligned, the stronger the overall signal that a trend has been formed.

Final thoughts
Trend trading is a tried-and-tested strategy that can be made as simple, or as complex, as you like. It can be used by beginners, intermediate and advanced traders, but only after conducting significant research on how to use it safely and effectively.
Visit the eToro Academy to learn more about trading trends and technical analysis.
FAQ
- How do you start trend trading?
-
To start trading trends, it’s important to find a safe, reputable broker that offers the markets that you’re interested in. Consider using a demo account to try and perfect your trend trading strategy before committing capital to a position.
- What is counter trend trading?
-
Some traders specialise in strategies that track the natural, short-term retracements of a longer term trend. For example, if the underlying trend is upwards, a counter trend trader might open a short position to try and catch an opposite price move.
- What are the risks of trend trading?
-
There is an element of risk attached to all trading, but the biggest challenge facing trend traders is paradigm shift: when a trend stops and potentially reverses. Trade management is also important when trend trading. Remember, not all trades will be successful, and it’s important to avoid emotional investing when the price of an asset doesn’t move in the way that you were expecting.
This information is for educational purposes only and should not be taken as investment advice, personal recommendation, or an offer of, or solicitation to, buy or sell any financial instruments.
This material has been prepared without regard to any particular investment objectives or financial situation and has not been prepared in accordance with the legal and regulatory requirements to promote independent research. Not all of the financial instruments and services referred to are offered by eToro and any references to past performance of a financial instrument, index, or a packaged investment product are not, and should not be taken as, a reliable indicator of future results.
eToro makes no representation and assumes no liability as to the accuracy or completeness of the content of this guide. Make sure you understand the risks involved in trading before committing any capital. Never risk more than you are prepared to lose.


