


TradingView is an exceptionally popular site for conducting trade analysis. Learn how to use TradingView and discover how TradingView’s tools can help to develop and improve investment strategies.
Trading involves conducting comprehensive research and utilising the best analysis tools possible. The TradingView platform is an obvious choice for those interested in accessing powerful, user-friendly indicators.
Tip: TradingView is used by more than 50 million traders and investors worldwide, who utilise it to identify trading opportunities in a wide variety of asset classes.

Guide to using TradingView
The TradingView platform is highly intuitive and there is a lot on offer. Whether you are trading forex, stocks, commodities or crypto, establishing the basics of how TradingView’s indicators work can help to improve your understanding of trading.
What is TradingView?
TradingView is a third-party trade research site. It is provided to clients by many brokers as part of their trading frontend. TradingView started out as a charting tool before expanding into a much more comprehensive service.
Traders and investors with access to TradingView can navigate to the price charts of thousands of global financial markets and find easy-to-read trading signals and technical indicators, which could be used to help them spot trade entry and exit points. With TradingView, it is also possible to compare symbols to see how different markets are acting and utilise the advanced stock screener to find promising assets.
As a result of TradingView’s popularity, a community of traders use it for research and analysis, as well as for sharing ideas on trades and live streaming their trades in action.
Tip: The “Community”, “News” and “Economic Calendar” sections of TradingView can help traders keep up to date with market events.
What tools are available on TradingView?
Primarily, TradingView is known for the many price charts that are available across a wide range of instruments. More than 100 pre-built indicators are available on these charts, including:
- Bollinger Bands (BB) — used to measure and demonstrate how far the price of an asset deviates from the long-term average
- On Balance Volume (OBV) — used to measure accumulation or distribution of an asset by comparing its price and trade volume
- Moving Averages (MA) — used to measure the average change in an asset’s price over time
- Keltner Channel — volatility bands used to determine the direction of a price trend
There are also more than 100,000 public custom indicators available to traders in the TradingView community. These can be added to any price chart to help identify price trends, and users can also utilise annotation tools to make personal notes on potential trading opportunities.
Despite there being thousands of trade indicators available on the platform, TradingView is set out in a way that helps you to focus on your trading. The dashboard is highly customisable, with indicators stored on the edges of the display. If you are away from your screen, cloud-based alerts can be set up to notify you of price moves.
Tip: The backtesting function allows traders to apply a manual or systematic strategy to previous market conditions to determine if a trading strategy has been profitable in the past.
How to use TradingView
Regardless of your chosen market, simply use TradingView’s search function, or your own personalised watchlist of popular markets, to click and navigate to the price chart of your choice.
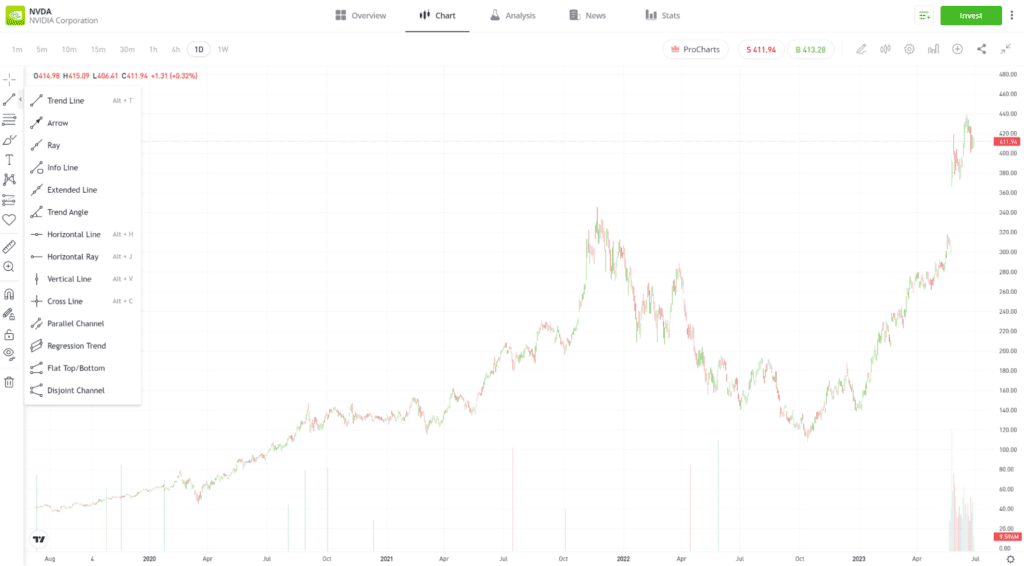
TradingView candles can be set to time frames ranging from one second to one year, and indicators are selected from a drop-down list found in the top toolbar. If you want to add annotation or use measuring tools and trendlines, there are more than 90 drawing tools that can be found on the toolbar on the left-hand side of the chart.
Past performance is not an indication of future results.
Source: eToro
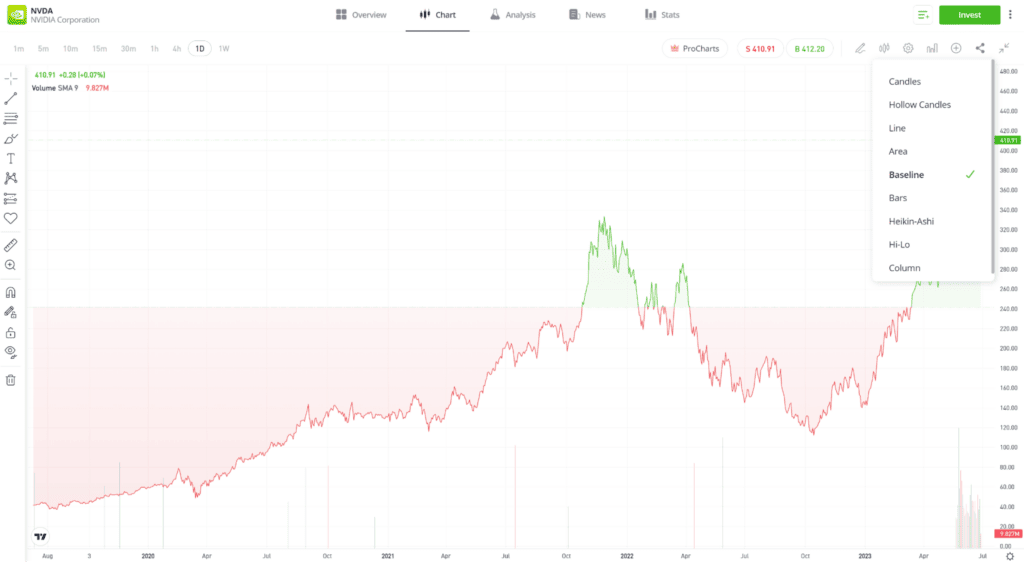
It is possible to choose from different kinds of chart types, including the following:
- Candlestick charts — displays the high, low, opening and closing prices of a security over a specific period
- Baseline charts — displays the price moves of an asset in relation to a point of reference, which is known as the baseline
- Heikin-Ashi — a Japanese chart, which translates as “average bar,” that uses modified candles to potentially make trends easier to spot
Past performance is not an indication of future results.
Source: eToro
You can also adjust the layout of your dashboard and screen colours.
TradingView’s state-of-the-art tools and price charts can be accessed on a desktop via a web browser or on a mobile device. The functionality of the service is the same, regardless of how you choose to access it.
Tracking stocks on TradingView
Past performance is not an indication of future results.
Traders can use TradingView to track stocks, as seen in the above example for Apple Inc.
Tracking crypto on TradingView
Past performance is not an indication of future results.
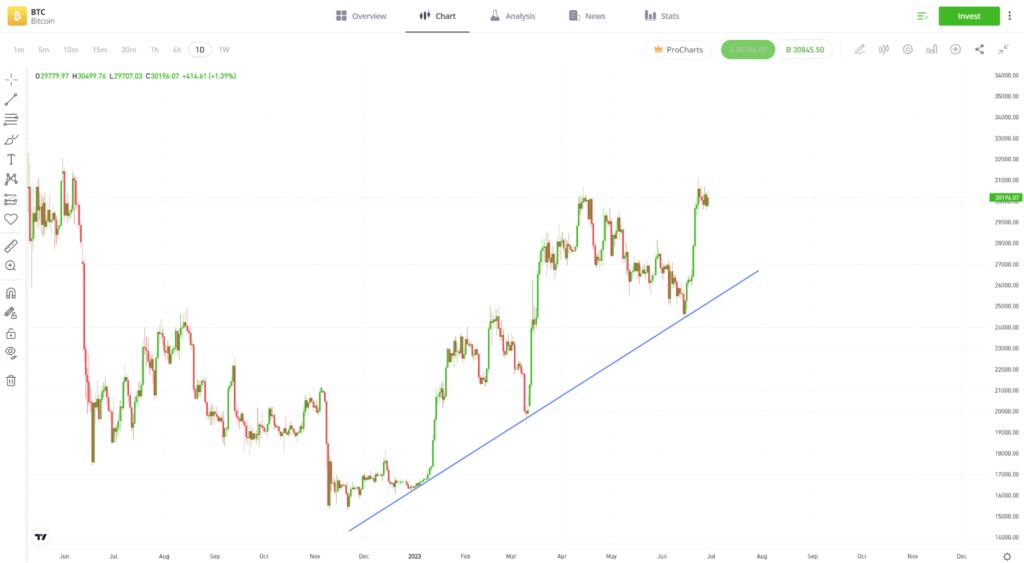
TradingView offers the ability to track a range of cryptoassets, including bitcoin.
Tracking forex on TradingView
Past performance is not an indication of future results.
Traders can monitor the price charts for a range of currency pairs, such as EURUSD.
Tip: The TradingView dashboard includes research and indicators that are based on fundamental, as well as technical, analysis.
Tips on using TradingView
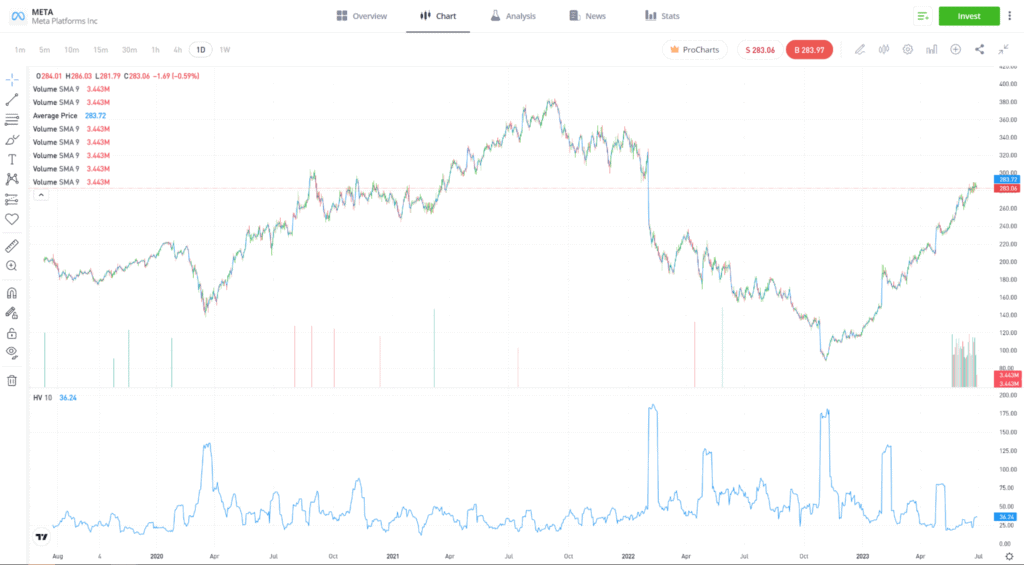
Accessing the drop-down list of default indicators is a good place to start unearthing the full potential of the TradingView platform. Your stock analysis can incorporate key metrics such as volume, average price and historical volatility.
Past performance is not an indication of future results.
Source: eToro
If you want a more visual interpretation of the price trends in a market, then the sidebar of annotation tools can help you to spot and monitor trends, such as the one seen in the bitcoin price chart below.
Past performance is not an indication of future results.
Source: eToro
“Through our partnership with TradingView, users will gain access to the very best charting tools, allowing them to make better informed trading and investing decisions.”
Gili Wolff
Using TradingView on eToro
Clients of eToro can access the powerful and intuitive TradingView charts by simply clicking or tapping a button on the home page of any asset they are monitoring on the eToro platform. Doing so will take them through to the TradingView platform and the whole range of customisable charts and indicators.
Alternatively, the eToro platform is also home to TradingView charts, as seen in the Microsoft example below. The time frames on these charts can be set between one minute and one week, but otherwise have the same functionality as those on the TradingView site.
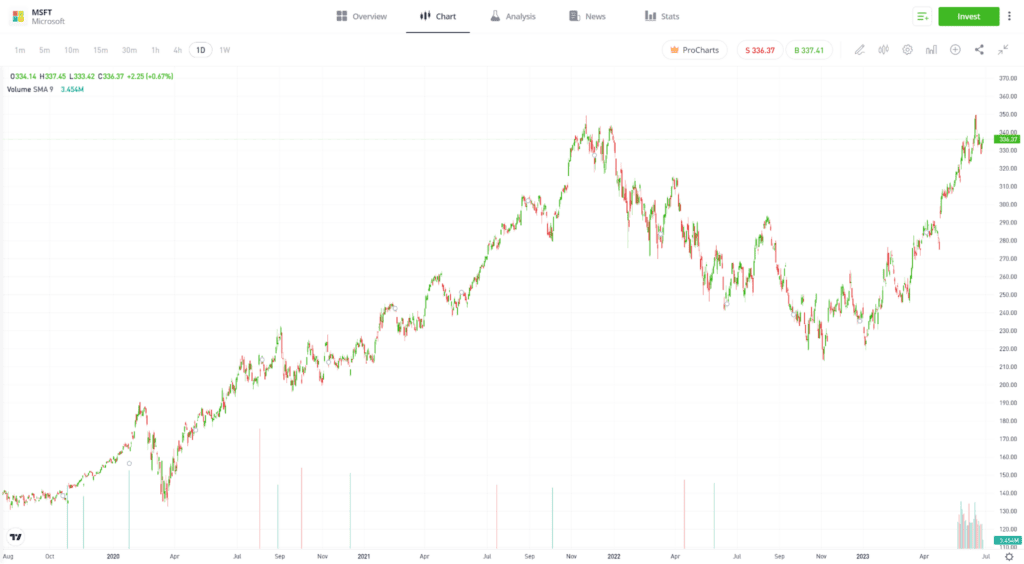
Past performance is not an indication of future results.
Source: eToro
- A vast array of tools for technical and fundamental analysis
- A huge number of markets and asset types are included
- Easy to compare different instruments on the same chart
- There are some limitations to the free version
- There is minimal customer support available
- The service is not included with all brokers
Final thoughts
TradingView is an ideal platform for analysing market data and helping traders to weigh up the pros and cons of buying or selling an asset. The platform has developed a range of additional features since its launch, but its core objective has remained the same.
Visit the eToro Academy to learn more about trading and investing.
FAQs
- Is there a charge for using TradingView?
-
The basic version of TradingView is free, although there is a monthly charge for advanced TradingView tools. Some brokers, such as eToro, provide their clients with free access to the platform as part of their overall package.
- What are the risks of using TradingView?
-
TradingView helps you to identify trading opportunities, and all trading comes with an inherent element of risk. While TradingView can’t help you to get around that issue, the research tools available can help a trader to make better-informed investment decisions.
- Can TradingView move the market?
-
TradingView is a tool for analysing markets; it cannot move the market itself. However, technical analysis trading indicators can be self-fulfilling if enough investors follow the same signal. With more than 50 million people using TradingView and reading the same “buy” and “sell” signs, there is always a possibility that large amounts of buying or selling activity can be triggered, thus impacting the price in any market.
This information is for educational purposes only and should not be taken as investment advice, personal recommendation, or an offer of, or solicitation to, buy or sell any financial instruments.
This material has been prepared without regard to any particular investment objectives or financial situation and has not been prepared in accordance with the legal and regulatory requirements to promote independent research. Not all of the financial instruments and services referred to are offered by eToro and any references to past performance of a financial instrument, index, or a packaged investment product are not, and should not be taken as, a reliable indicator of future results.
eToro makes no representation and assumes no liability as to the accuracy or completeness of the content of this guide. Make sure you understand the risks involved in trading before committing any capital. Never risk more than you are prepared to lose.
CFDs are complex instruments and come with a high risk of losing money rapidly due to leverage. 77% of retail investor accounts lose money when trading CFDs with this provider. You should consider whether you understand how CFDs work and whether you can afford to take the high risk of losing your money.
Cryptoasset investing is highly volatile and unregulated in the UK and some EU countries. No consumer protection. Tax on profits may apply.