


Candlestick patterns offer immediate insights into market conditions and can often be used to identify signals that suggest that the price will shortly go up or down. Candlestick pattern analysis considers each candlestick’s real body and the length of its shadows.
Technical analysis chart patterns, formed by price movements, are closely monitored by traders and investors. This is because the shapes formed on charts can act as indicators of future price moves.
Tip: Pattern trading can be used to trade any financial market.
What are charting patterns?
Chart patterns are shapes formed as price data is recorded on charts over time. When particular patterns form, they can offer indications as to which direction the price might move in the future.
Generally speaking, the more signals that align, the greater confidence you can have in a trading decision.

Key charting patterns for technical analysis
Some patterns appear relatively frequently, while others occur less often. Remember, each pattern must be considered within its particular context — the frequency with which a pattern forms does not necessarily influence the degree to which it will be accurate.
Uptrend
Uptrends are formed when price action makes higher highs and higher lows. Upward trendlines are formed by connecting at least two of the price lows.
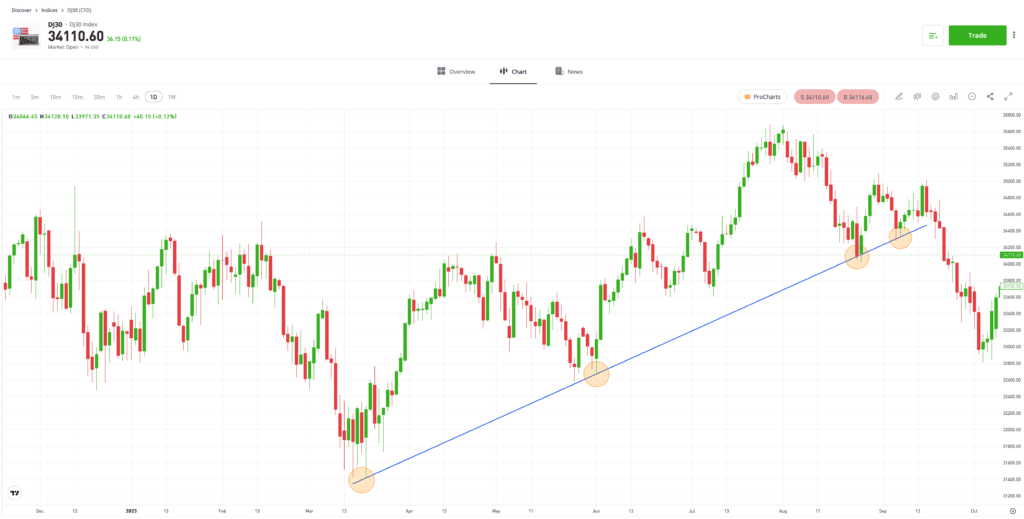
Past performance is not an indication of future results
Source: eToro
Downtrend
Downtrends are formed when price action makes lower highs and lower lows. Downward trendlines are formed by connecting at least two of the price highs.
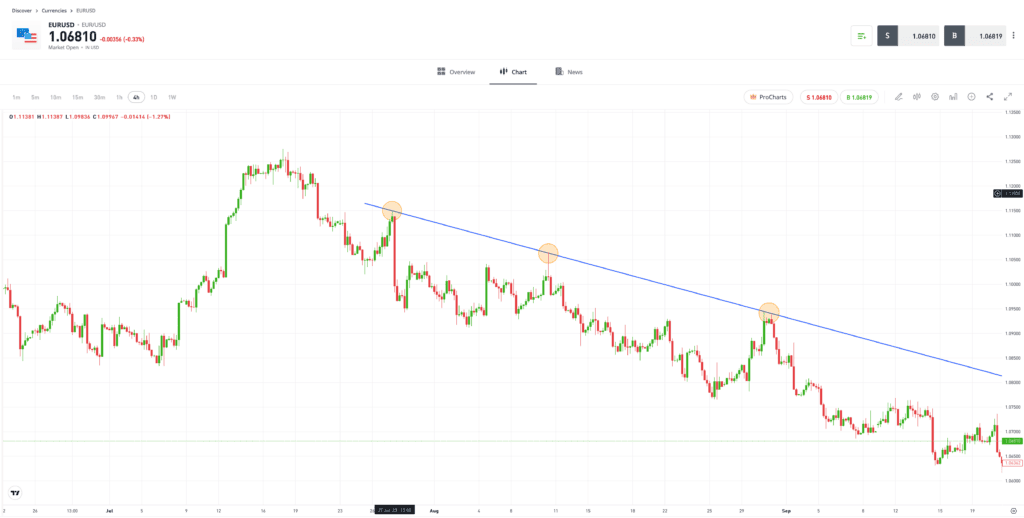
Past performance is not an indication of future results
Source: eToro
Double/triple top & bottoms
A double or triple top pattern is formed when an upward trend fails to break through a price resistance level, despite making at least two attempts to do so. Double and triple bottoms are formed when a downward trending market bottoms out at a support level.
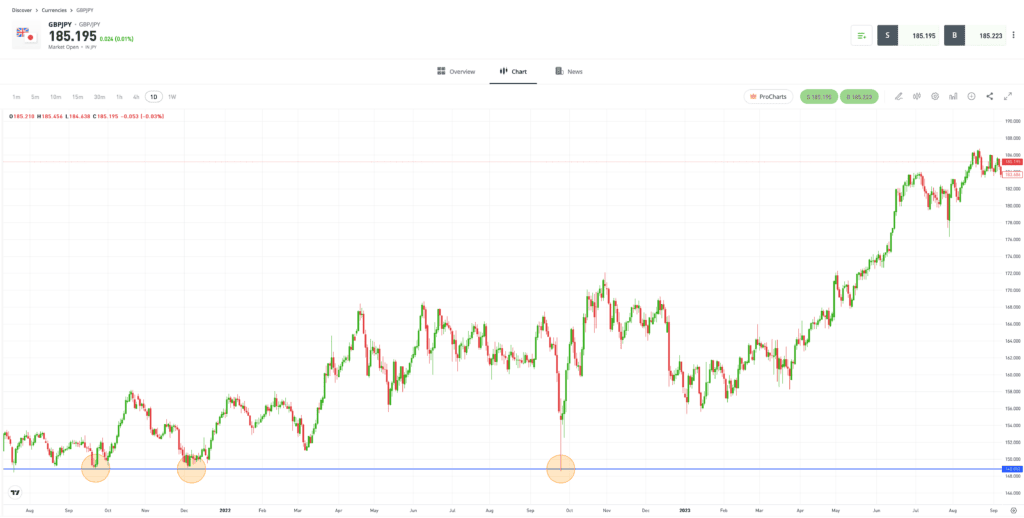
For illustration purposes only. Past performance is not an indication of future results
Source: eToro
Rectangles
When price trades sideways, the highs and lows of the trading channel can be used to form a rectangular price pattern. Rectangle patterns offer an opportunity to range trade, which involves buying at the bottom and selling at the top of the range.
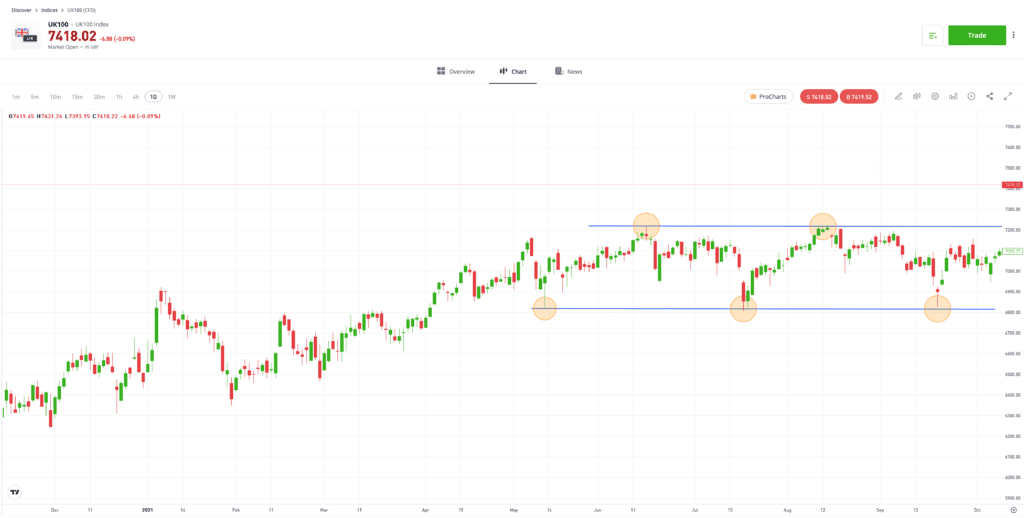
Past performance is not an indication of future results
Source: eToro
Flags & pennants
In some patterns, an upward price move can be interpreted as a flagpole, and when followed by a period of price consolidation, the chart forms the shape of a flag or pennant.
A breakout of the flag or pennant to the upside can be seen as an indicator of further bullish price movement, while a downward break is a
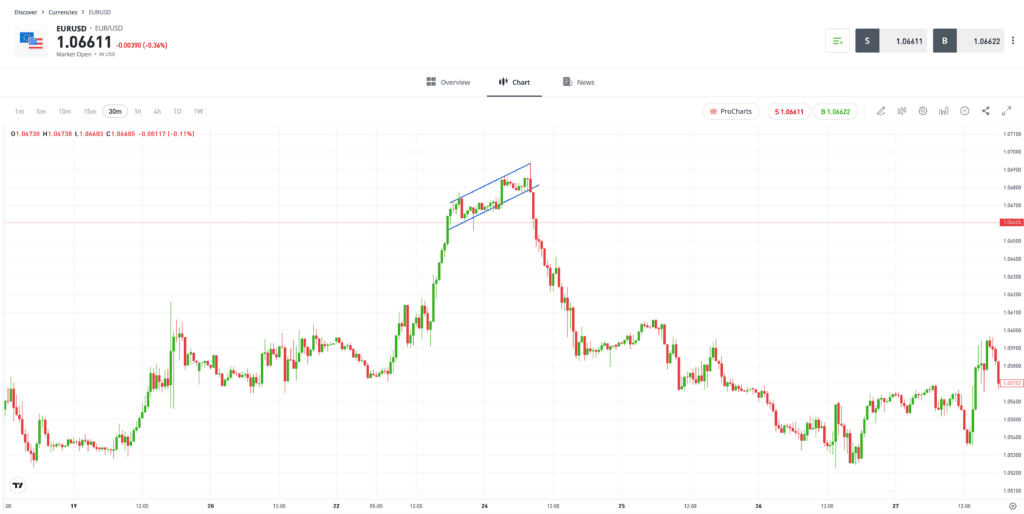
Past performance is not an indication of future results
Source: eToro
Head & shoulders
A head & shoulders pattern is similar to a triple top pattern, except that the central price spike is higher than the surrounding two price highs. It also incorporates a “neckline” support/resistance price level, and a break below this is considered a bearish signal.
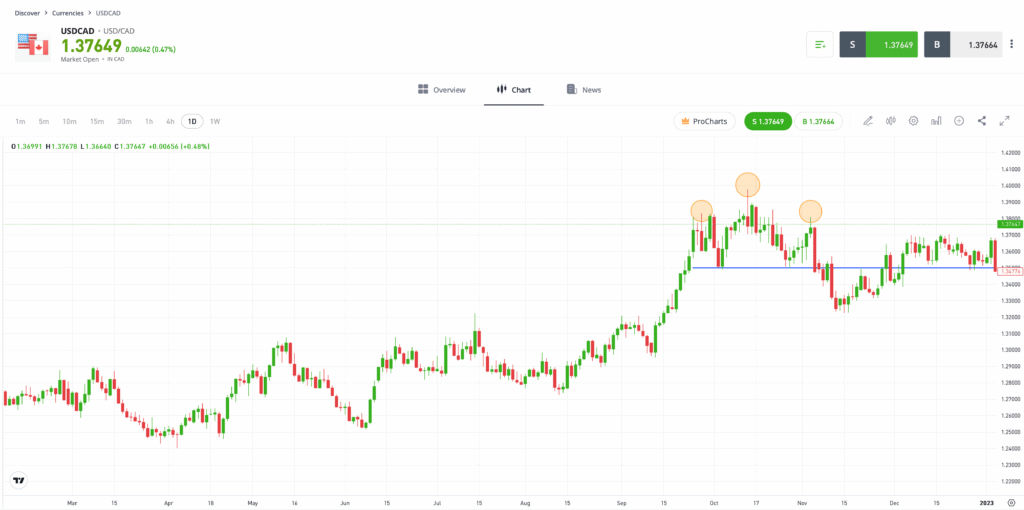
Past performance is not an indication of future results
Source: eToro
What are candlestick patterns?
Candlestick chart patterns consider price history over a specific time interval and can therefore be used to identify future price moves.
They allow investors to consider data relating to the opening price, closing price, low price and high price of an asset, across one of a range of time intervals.
Each candle is, itself, a pattern, though it is also possible to find signals by considering the pattern formed by a sequence of candles.

Key candlestick patterns
Candlestick pattern analysis considers each candlestick’s real body and the length of its shadows, which is enough information for some traders to build an effective strategy with.
Doji
These occur when buyers and sellers push an asset’s price to relatively extreme lengths during a particular time period, but the price ends up close to where it started at the end of the trading session. A doji is typically considered a sign that there is a degree of indecision in the markets.
Shooting star
This is a candlestick pattern found in an upward trending market, and it typically points to
Hammer
Similar to the shooting star, a hammer is a
Inverted hammer
An inverted hammer is formed by the opening, closing and low price of candlesticks being similar, with a long upper shadow pointing to the potential for bullish price action to be seen at some point during the session. It is usually considered a sign that a bearish trend might be about to reverse.
Hanging man
Similar in shape to the inverted hammer, the hanging man is seen when price is trending upward, not downward.
Star
A star signal can indicate the reversal of a downward or upward trend. The key element is the smaller real body of the second candlestick, and a gap existing between the bodies of the two candles.
Doji star
A doji star is a trend reversal signal. It is similar to the star signal, but the second candle forms a doji pattern.
Harami
A harami is formed when the real body of a second candle is contained within the body of the preceding one. If the first candle is in line with the current trend, a harami can suggest that the trend is about to reverse.
Tip: Patterns that form over a longer time frame typically have a greater influence on long-term price moves.
How do traders use candlestick patterns?
Candlestick patterns are incredibly popular. The widespread use of trading candlestick patterns is largely based on the key features of the approach.

- Instant recognition: Candlestick patterns allow you to instantly identify market conditions, which is particularly useful in fast-moving markets.
- Simplicity: Candlestick patterns are relatively easy to learn.
- Trade entry and exit points: Candlesticks indicate whether a trend will continue or reverse, while also offering specific trade entry and exit points — for example, if the price breaks through the resistance/support formed by the top or bottom of the wicks on the previous candle.
Tip: Some patterns are more reliable indicators in a bullish market, while others are best used in a bearish one.
What is pattern trading?
Pattern trading involves using patterns formed by price moves to identify opportunities to buy or sell. As those two variables form the basis of all price charts, the approach can be applied to any market, from stocks to crypto. Some candlestick pattern indicators are considered “stronger” than others.
Final thoughts
The distinctive patterns formed by price action have a committed following. Primarily, this is down to them being easy to identify, but it also helps that they give off relatively clear signals.
Remember, chart and candlestick patterns can be self-fulfilling. With so many market participants watching the same setup, price moves can build momentum as cash flows into, or out of, a market.
Visit the eToro Academy to learn how to use different chart pattern indicators.
Quiz
FAQs
- What kind of traders use pattern analysis?
-
Chart and candlestick patterns can be used to trade any market, on any time frame. They can be used by long-term investors to fine-tune trade entry points, even if the decision to buy is based on fundamental analysis. Alternatively, day traders may consider basing their decisions entirely on candlestick patterns when opening short-term trades.
- What is an engulfing candle?
-
Engulfing candlestick patterns occur when the real body of a second candle has a higher top and lower bottom than the previous candle. They can signal that a trend is about to reverse.
- What is the difference between a shooting star and a hammer candle?
-
Both of these candlestick patterns have the same characteristic shape. The fundamental difference is that a shooting star is used to spot the reversal of an upward trend and the hammer is found when a downward trend could be about to end.
This information is for educational purposes only and should not be taken as investment advice, personal recommendation, or an offer of, or solicitation to, buy or sell any financial instruments.
This material has been prepared without regard to any particular investment objectives or financial situation and has not been prepared in accordance with the legal and regulatory requirements to promote independent research. Not all of the financial instruments and services referred to are offered by eToro and any references to past performance of a financial instrument, index, or a packaged investment product are not, and should not be taken as, a reliable indicator of future results.
eToro makes no representation and assumes no liability as to the accuracy or completeness of the content of this guide. Make sure you understand the risks involved in trading before committing any capital. Never risk more than you are prepared to lose.