What are the Greeks in options?
When trading options, the “Greeks” are an essential part of the experience. These metrics offer a window into the option contract’s volatility and potential price changes over time. You can think of them kind of like the nutrition facts listed on food products. Traders use these to determine how healthy, mild, or spicy the contract is.
There are four major Greeks we’ll cover today (and a bunch of minor Greeks we’ll leave for another time). Each Greek has its own function and, for lack of a better word, personality.

DELTA
“The Leader”
This is arguably the most popular Greek. Think of Delta as the leader of a ragtag group of friends, out on the town and looking for fun.
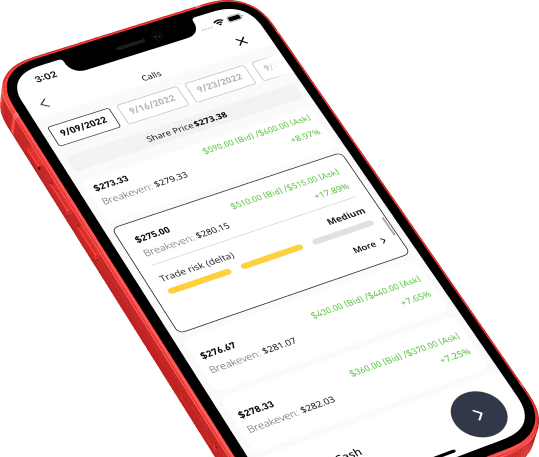
Delta tells you how much the price of an option will change if the underlying stock’s price goes up or down $1.
For example: Say the price of a call option is $5, the price of the stock is $150, and the Delta is 0.20. If the stock goes up to $151, the option price should increase to $5.20 (Delta + option price = new option price).
It’s important to note: the more the option is out of the money (OTM), the more Delta becomes a negligible metric.
As time goes on, the Delta changes. It’s important to note that put options have negative Deltas.
Aside from reading the Delta as the amount of money an option’s price will increase or decrease, it’s also widely seen as the probability that the option will expire in the money.
If the Delta is 0.20, the option is seen as having a 20% chance of expiring in the money.
These two ways of looking at Delta tell the option trader so much about how valuable the option is. That’s why Delta is often seen as the most popular of the Greeks.

GAMMA
“The Sidekick”
As Delta’s right-hand man, Gamma focuses on Delta’s expected rate of change.
For example: If Gamma is 0.05 and Delta is 0.20, we will expect the next Delta change after the first $1 increase to be an additional 5 cents (Gamma). Watch it in action…
STOCK PRICE = $150
OPTION PRICE = $5
DELTA = 0.20
GAMMA = 0.05
And then the stock increases $1…
STOCK PRICE = $151
OPTION PRICE = $5.20
DELTA = 0.25
GAMMA = 0.07
Did you catch that? Gamma changed Delta, which will in turn change the price of the option once the stock price increases or decreases. It’s like dominos — once one falls, they all do.
Gamma is great because it’s a predictor of the stability of Delta. Delta tells you how much the price of the option will change, but how do we know what happens after that $1 fluctuation? Gamma. It’s what traders look at to see how stable the option price is when the stock price moves. With a Gamma of 0.05, that’s pretty stable — no major price swings coming. But, Gamma gets higher for options that are in the money and closer to expiring. So keep your eye on Delta’s shifty sidekick.

Theta
“The Naysayer”
In every group, there’s always that one person who bets against their success — the one always warning about the odds. They are the helpful voice of reason, grounding the excitable bunch. In options trading, Theta is that naysayer.
Theta is almost always a negative number, and it represents how much value the option price is losing with time. (Implied Volatility can influence this, too — more on this below.)
For example: A Theta of -0.10 means that your option’s price will decrease by 10 cents every day.
Theta is working against you — showing you how much you’re losing every day, so you need to use the other Greeks to determine how much you stand to gain against Theta. As an options contract gets closer to expiration, Theta tends to increase, a sign that your time is running out.
It’s important to note: eToro currently doesn’t support the ability to short an option. However, if you were to short an option, Theta becomes your friend!

Vega
“The Wildcard”
Vega is a bit of an outlier compared to the other three Greeks mentioned, in that it’s directly impacted by a since unmentioned metric. That metric is called Implied Volatility (symbol = σ, aka sigma). All options contracts will contain an implied volatility number. This number is calculated using a complex options pricing model, but it basically illustrates the price swings of the underlying stock. A high implied volatility means the price of the underlying stock is likely to make a sudden swing — either upward or downward. The opposite is also true — a low IV will mean the stock price probably won’t increase or decrease all that much. It’s important to note that probably and likely mean just that — they are not certainties.
Vega estimates how much the price of the options contract will change with each percentage point change of implied volatility. Vega is always a positive number, the equation for using Vega generally looks like this: IV x Vega = Option price change.
For example: XYZ stock’s Implied Volatility increases by 2 and the Vega is 0.2, as a result, the value of the option should theoretically increase by $0.40 (Implied Volatility x Vega).
That’s why Vega is the wildcard of the bunch. They are operating off a different set of rules — uncertainty! But this is still a very important metric to look at when judging the potential “success” of an options contract.
Cheat sheet:
| Delta |
|
| Gamma |
|
| Theta |
|
| Vega |
|
Exception to Note:
The more an option is OTM, the less it trades like the underlying — in both directions.
Example: I have an XYZ call option for $110. The current price of XYZ is $100. If XYZ goes up 11%, my option’s value will go up dramatically, far more than 11%!
Example: I have an XYZ call option for $110. The current price of XYZ is $100. If XYZ goes down 11%, my option’s value will decrease dramatically, much more than 11%.
*All examples used in this article are hypothetical and meant for educational purposes
This communication is for information and education purposes only and should not be taken as investment advice, a personal recommendation, or an offer of, or solicitation to buy or sell, any financial instruments.
This material has been prepared without taking into account any particular recipient’s investment objectives or financial situation and has not been prepared in accordance with the legal and regulatory requirements to promote independent research. Any references to past or future performance of a financial instrument, index or a packaged investment product are not, and should not be taken as, a reliable indicator of future results.
eToro makes no representation and assumes no liability as to the accuracy or completeness of the content of this publication.


