

The S&P 500 has now encountered a death cross — it’s first since 2022. The Daily Breakdown digs into what investors should know now.
Thursday’s TLDR
- S&P 500 enters a “Death Cross”
- But the recent stats don’t back it up
- Intel looks for potential support
What’s happening?
Before we dive in, let’s make sure you’re set to receive The Daily Breakdown each morning. To keep getting our daily insights, all you need to do is log in to your eToro account.
By now I’m sure some of you have read that the S&P 500 has entered — by technical terms — a “Death Cross,” an alarming name that describes when the 50-day moving average crosses below the 200-day.
This is a bearish technical development and used by some technicians as an indicator to suggest that there’s more downside to come.
Make no mistake: It is a bearish development, because it usually requires a steep decline to drag the 50-day down below the 200-day. However, I view it more as a bearish observation rather than a bearish indicator and I’ll tell you why.
It’s like finding out we’re in a recession…six months into the recession when the economy has already started to rebound. Markets are forward-looking, meaning that investors are trying to price in future realities — like earnings and margins — in the present. They don’t necessarily care that the 50-day (a lagging moving average) dropped below the 200-day (and even slower, lagging moving average).
But we don’t do things based on gut feelings or opinions here. We look at the facts and the hard data. So I went back and looked at the other seven death crosses since the S&P 500 made its Financial Crisis low in 2009.
And you know what? It’s a lot less scary than even I thought.
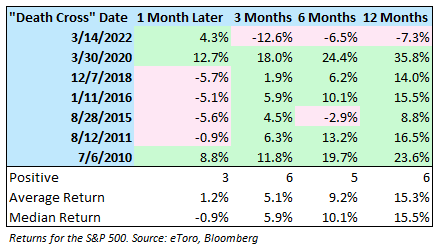
In almost half of the instances (3/7), the S&P 500 had already made its low for that particular pullback by the time the death cross had occurred. Additionally, the largest decline that occurred after the death cross was less than 7% in five of the seven instances. The two outside that range? Declines of 11.1% and 14.5%, respectively.
Looking back at the seven other instances over the last 15 years, we found that one month later, the S&P 500 was lower four times with a median decline of 0.9%. However, three months later, the index was higher six times with a median return of 5.9%.
When looking at 6 and 12 months later, the data points to a similarly improving situation where the S&P 500 was higher five and six times, respectively, with median gains of 10.1% and 15.5%, respectively.
The Bottom Line: The most recent death cross statistics of the last 15 years aren’t necessarily bullish, but they hardly represent the frightening premonition that the name seems to imply. It’s clear that this lagging indicator did not, even somewhat consistently, show that stocks are bound to fall off a cliff. While that doesn’t mean markets can’t deteriorate from current levels due to ongoing macroeconomic issues, a technical death cross for the S&P 500 isn’t the end-all, be-all knockout that it may seem to be.
Want to receive these insights straight to your inbox?
The setup — Intel
It’s been a tough run lately for chip stocks like Intel, Nvidia, Advanced Micro Devices, Broadcom and even ASML. That has put pressure on the SMH ETF as well.
While Intel has lagged many of its peers, investors want to know if it can continue to find support in the $18 to $19 area.
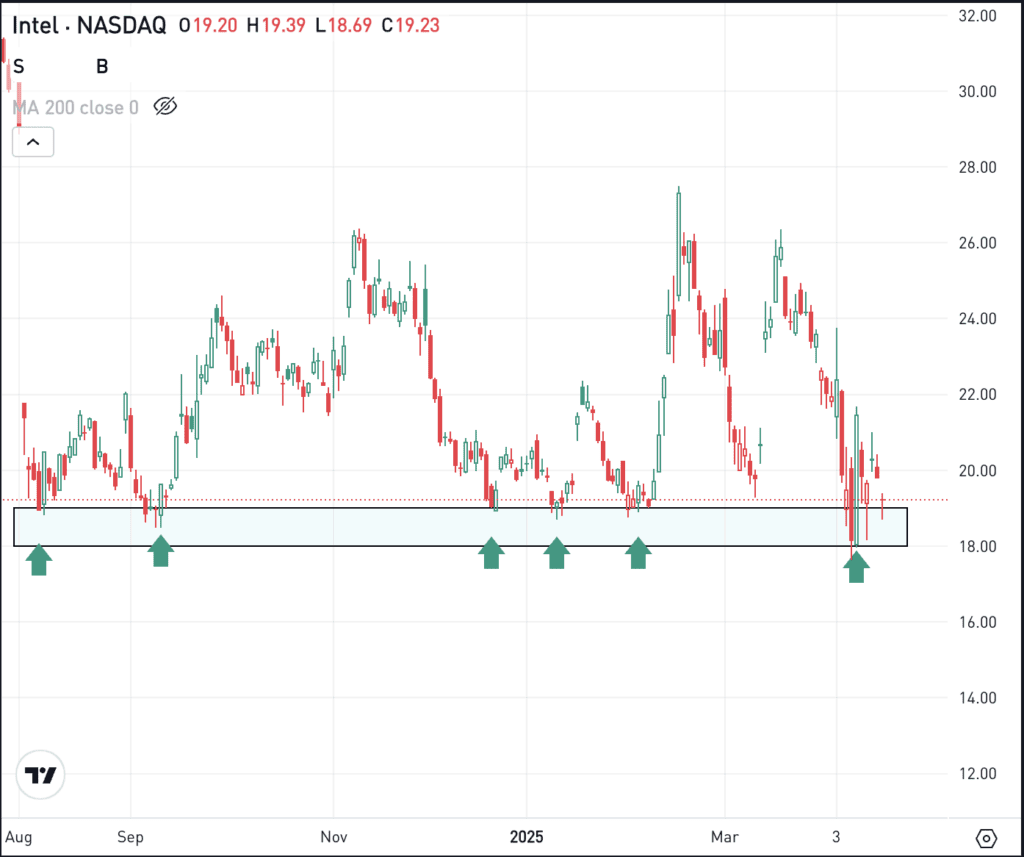
Bulls who believe INTC can stage a rebound might consider using this support zone as part of their planning. The stock recently made a 52-week low near $17.50 — temporarily breaking this support zone before rebound back above $21.
If the stock breaks back below $17.50 — or worse, closes below it — then some investors might consider that a time to exit the trade.
If support continues to hold, Intel may be able to bounce. Shares have been rangebound between $18 and $19 on the downside and $26 on the upside. However, if support fails, then more downside is possible in this name.
Options
For options traders, calls or bull call spreads could be one way to speculate on support holding. In this scenario, options buyers limit their risk to the price paid for the calls or call spreads, while trying to capitalize on a bounce in the stock.
Conversely, investors who expect support to fail could speculate with puts or put spreads.
For those looking to learn more about options, consider visiting the eToro Academy.
Disclaimer:
Please note that due to market volatility, some of the prices may have already been reached and scenarios played out.