


The Daily Breakdown takes a closer look at Chinese equities, as Alibaba has led a strong year-to-date rally in this group.
Wednesday’s TLDR
- China stocks jump in 2025
- BABA earnings due this week
- INTC rallies 16%
What’s happening?
There’s been a lot of focus on Chinese equities lately and understandably so. That’s as one of the largest economies in the world has been largely left out of a global rally in risk assets — until now.
The S&P 500 has hit record high after record high over the last year (and did so again yesterday), while other indices from around the world — from Europe to Japan — have done so as well.
However, Chinese equities have continued to lag.
Alibaba, Baidu, JD.com and others were once crown jewels for China-focused investors and were even mentioned alongside some of the largest tech names in the US, like Amazon and Alphabet.
Now though, the group has found some pep in its step lately.
Alibaba is up 49.6% this year, while Pinduoduo has climbed 32.5%. The ETFs have found some momentum too, with the iShares China Large-Cap ETF (FXI) up 16% in 2025 and the China Internet ETF (KWEB) up nearly 22%.
Just as a reminder, Baidu reported earnings yesterday, while Alibaba reports on Thursday.
Want to receive these insights straight to your inbox?
The setup — Dow Jones
Up an impressive 4.8% in 2025, the Dow Jones is slightly edging out the S&P 500 in year-to-date performance. However, investors are wondering if it will make new record highs like the S&P 500 just did.
A popular Dow ETF is the DIA, and for it to make a new record high, it will need to clear $451.55. That mark was set on December 4th.
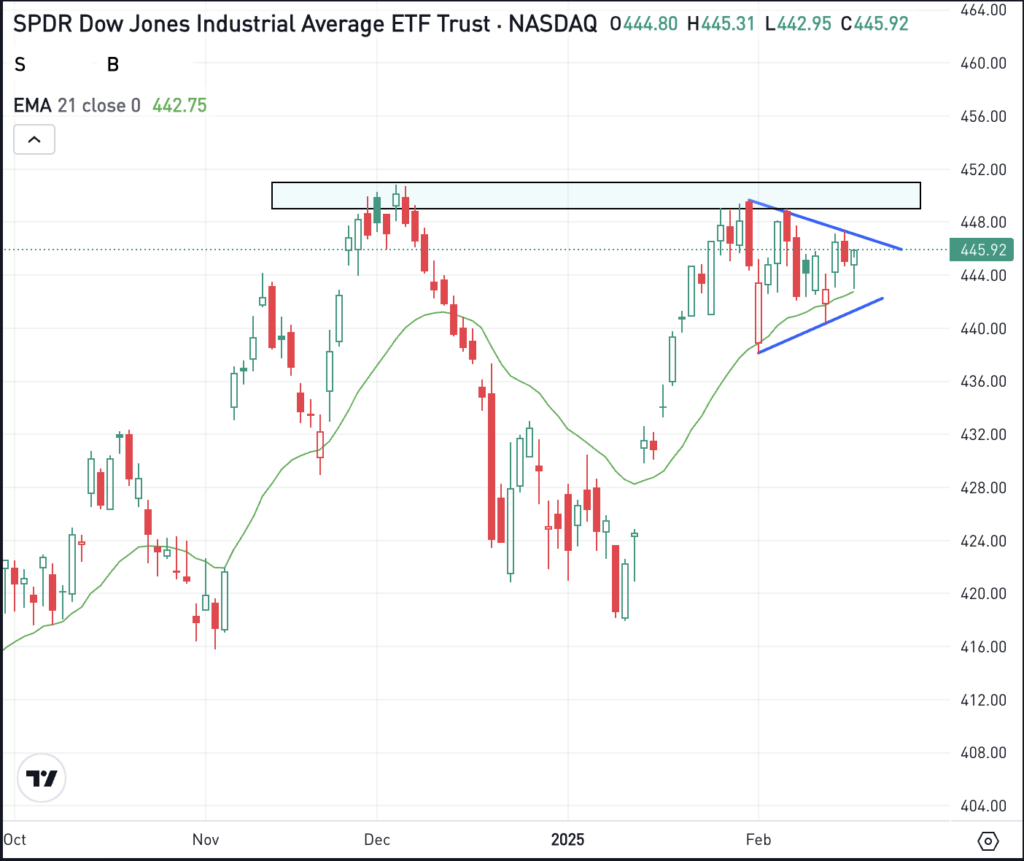
Notice how the $450 area has been resistance for DIA, which has now been in place for several months. The ETF is also forming a “wedge” pattern, constructed of higher lows and lower highs, and is highlighted by the blue lines on the chart.
Currently, it’s consolidating just below key resistance.
Bulls are hoping to see an eventual push up through $450, triggering a potential breakout and ushering in more bullish momentum. Bears are hoping that resistance remains intact and that the selling pressure eventually pushes the ETF lower.
Options
Investors who believe shares will break out — or those who are waiting for the potential breakout to happen first — can participate with calls or call spreads. If speculating on the breakout rather than waiting for it to happen first, investors might consider using adequate time until expiration.
For investors who would rather speculate on resistance holding, they could use puts or put spreads.
To learn more about options, consider visiting the eToro Academy.
What Wall Street is watching
INTC – Shares of Intel jumped higher on Tuesday, climbing about 16% as Broadcom and TSMC reportedly explore bids for parts of Intel’s business. Yesterday’s gains add to Intel’s recent rally, after the stock climbed more than 23% just last week. For the year, the stock is now up more than 36%. Check out Intel’s chart.
NSDQ100 – The Nasdaq 100 hasn’t had the smoothest ride so far in 2025, but it’s now hit record highs in back-to-back sessions. Previously, December 16th marked the index’s record high, but tech is starting to find some traction. Investors following this group may have noticed that yesterday the QQQ ETF hit its first record high since mid-December.
Disclaimer:
Please note that due to market volatility, some of the prices may have already been reached and scenarios played out.