

The Daily Breakdown takes a closer look at Meta, which is enjoying a record win streak to record highs. Here’s what the charts show.
Thursday’s TLDR
- Inflation comes in hot
- Stocks bounce off morning lows
- Meta’s win streak extends
What’s happening?
Yesterday’s inflation print was not the reassuring report that investors wanted.
Last month’s two major inflation reports — the CPI and PCE — were not as bad as feared, allowing Wall Street to breathe a sigh of relief. There’s a worry among some investors that inflation is rebounding, triggering a flight response from some given the turmoil that inflation caused in 2021 and 2022.
The Nasdaq 100 and S&P 500 opened lower by about 1% yesterday after the CPI report for January came in ahead of economists’ estimates. Yet stocks powered off the lows, with the Nasdaq finishing higher yesterday.
I was really impressed with that action. While there were some silver-linings to glean from the report — and the reality that stocks actually do pretty good in mild inflation environments — markets could have easily sank based on those headline figures.
Some of those silver linings include a decline in Core Services inflation — the stickier component to inflation — and the fact that inflation numbers tend to be higher in the beginning of the year due to annual price increases. Lastly, there’s reasonable speculation that prices jumped ahead of tariffs that were expected to go into effect in early February.
All that to say this: Markets handled yesterday’s bad news pretty well — and that’s a good thing.
Want to receive these insights straight to your inbox?
The setup — Meta
Meta has been on one amazing ride. Shares have climbed in 18 straight sessions, gaining more than 18% in that span!
It’s the best-performing Magnificent 7 stock so far this year, up almost 24%. The next-best performer is Amazon, up just 4.3%.
This chart does a great job highlighting the prior action, giving technical investors something to watch for in other stocks.
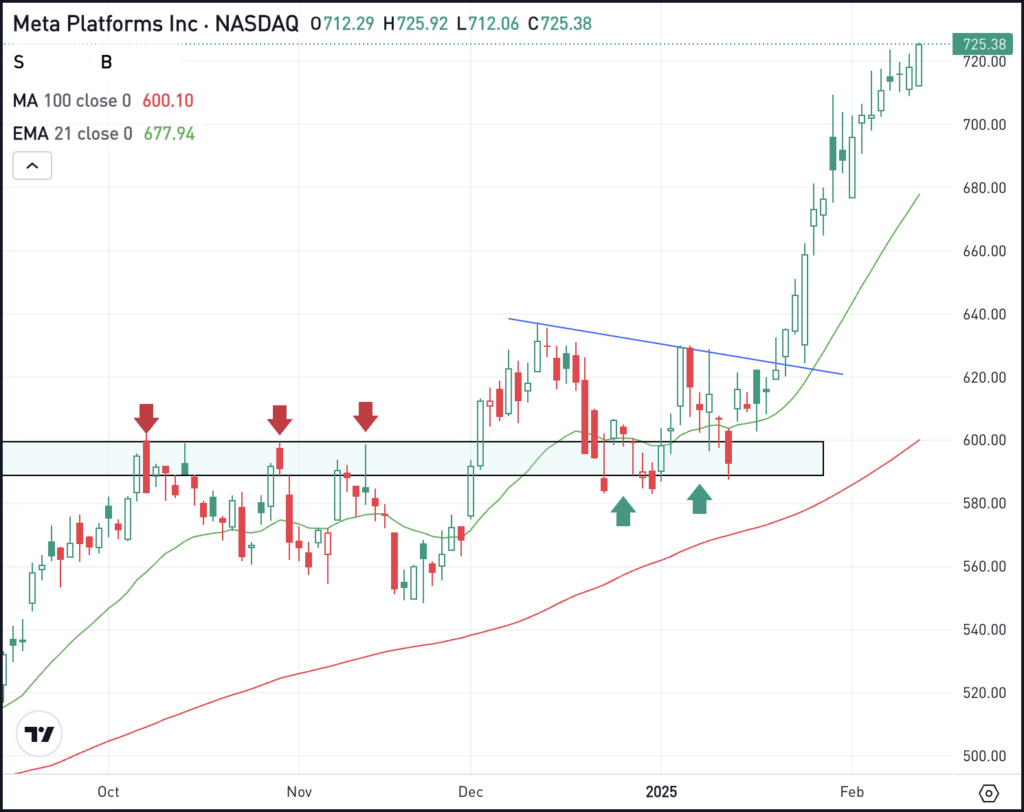
Notice how Meta chopped around the $600 area, which was resistance for most of Q4, then support from December to January. It eventually led to a breakout over downtrend resistance, which has now fueled this tremendous rally.
Investors shouldn’t expect winning streaks that last almost a month, but they sure are nice when they happen.
In the case with Meta, some investors likely consider it a buy-the-dip candidate once the stock eventually pulls back.
What Wall Street is watching
APP – Shares of Applovin are roaring higher this morning, up more than 25% in pre-market trading. The stock is climbing after a better-than-expected earnings report and solid guidance. This morning’s rally should send shares to new record highs. Check out the chart.
RDDT – On the flip side, Reddit is lower this morning, dropping about 8% after the firm reported earnings. The company handedly beat earnings and revenue estimates, but missed on user expectations. That’s as global daily active uniques rose 39% to an average of 101.7 million, missing estimates of 103.1 million.
Disclaimer:
Please note that due to market volatility, some of the prices may have already been reached and scenarios played out.