

The Daily Breakdown takes a closer look at this week’s spike in the VIX and what it means for long-term investors.
Friday’s TDLR
- Volatility spikes have boded well for long-term investors.
- How options can hurt — and help — traders during volatile times.
- Apple faces a key level on the charts.
The Bottom Line + Daily Breakdown
The S&P 500, Bitcoin and volatility have been all over the place this week.
On Monday, the Volatility Index (the VIX) traded as high as 65.73 — up 181% from Friday’s close — and ended higher by ~65% that day.
That ended up being the second-largest one-day rally for the VIX — ever. The next day, it fell more than 28%, the second-largest one-day drop ever.
For Long-Term Investors…
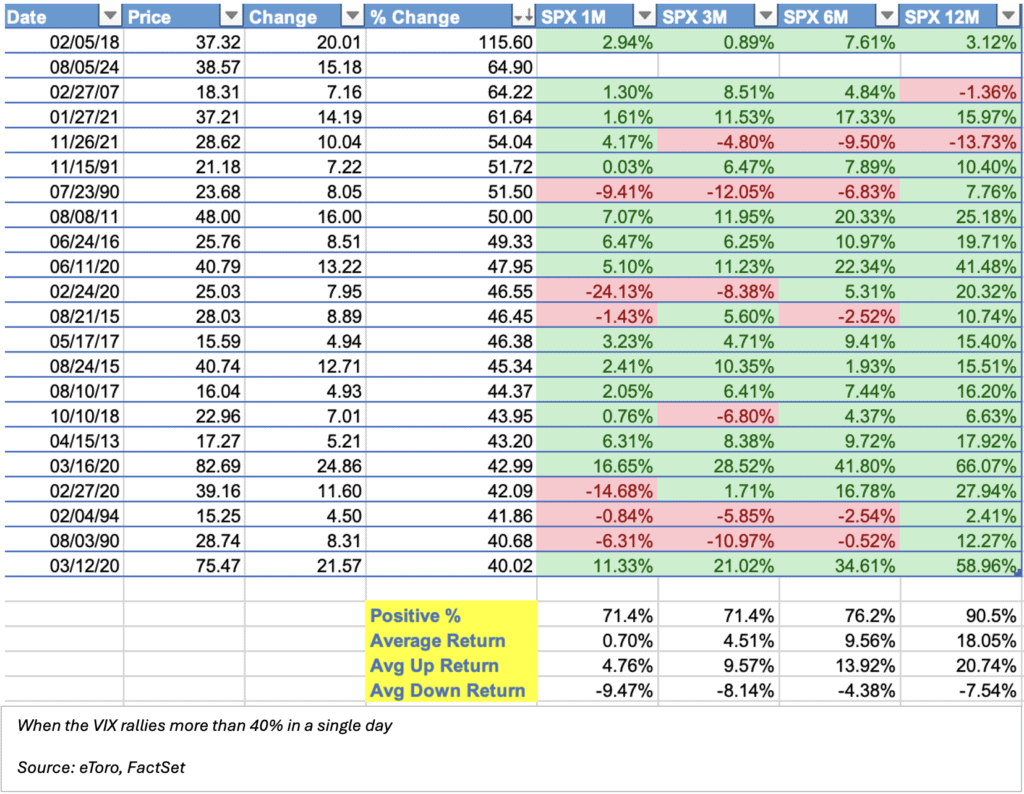
Given the volatile nature of the current environment, another volatility spike isn’t out of the question. Historically though, these bursts of volatility have boded well for long-term investors.
Before this week, there had been 21 instances where the VIX rose by more than 40% in a single day. One year later, the S&P 500 was higher 90.5% of the time with an average return of 18%. Otherwise, it’s higher about 70% to 75% of the time one, three, and six months later.
For Short-Term Traders…
Imagine you came into Monday fully loaded in call options, speculating for a bounce. Well, that would have been a very painful day for that portfolio — underscoring the risk that these options can go to zero. If a trader has their entire portfolio in options — particularly short-dated options — there’s a risk they can get wiped out.
An option losing all of its value is an obvious con to options…until you realize it can be a pro too. The key is acting like a professional.
A pro would never fully load their entire portfolio with short-dated options. It’s too risky. But they could certainly justify having some options exposure — and knowing that the option can become worthless is actually a huge advantage.
Options Like a Pro
Experienced options traders take this “maximum loss” reality from a negative — knowing that it can lose all of its value — and turn it into a positive, by knowing exactly how much they’re willing to risk going into a trade.
Imagine coming into this week fishing for a bounce in Apple, which ended near $220 on Friday.
One session later at Monday’s low, AAPL was down almost $24 a share and closed lower by more than $10 a share. If a trader were long 100 shares — costing a total $22,000 — they would have been down nearly $2,400 at one point on the day and would have ended the day with an unrealized loss of more than $1,000.
Ouch.
However, had they looked for a bounce using this week’s $225 calls, they could have paid about $180 — which would have been their maximum risk. Even if Apple fell $100 a share, this call option would only lose what the trader paid for it, or $180.
As of Thursday’s close, this option is basically worthless — trading for $1 as we go into Friday’s expiration — whereas the stock is still down $6.50 a share, leaving the trader with 100 shares down $650.
The Bottom Line
Sometimes volatility can come out of nowhere. When it does, it catches a lot of traders off-guard. Those with too much short-term options exposure may be cursing, but those with properly sized options exposure may be breathing a sigh of relief.
Of course, options with more time until expiration can ease some of the difficulty with volatility, even though the premiums (the cost) are higher than short-dated options.
The setup — AAPL
We talked about Apple in the first section, so let’s take a closer look at it.
Notice how Monday’s action was a nasty move lower. But on the plus side, Apple found support just below $200 as prior resistance acted as current support — that’s a bullish development traders like to look for.
However, note that Apple continues to struggle with the $213 to $215 area, topping out in this zone in three of the last four sessions, including today. This area was support in late July and it’s also where the stock finds its 50-day moving average.
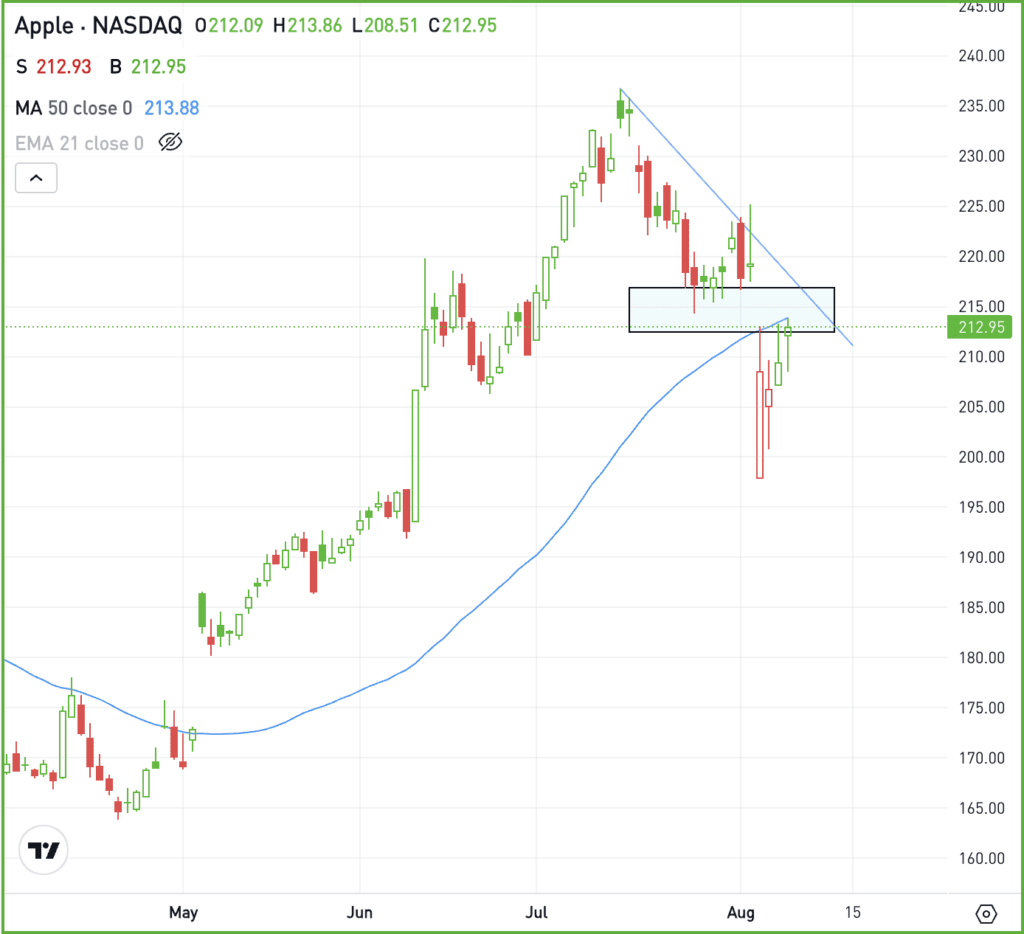
If Apple can clear this zone, then perhaps the rally can continue. However, if resistance doesn’t break and AAPL rolls back over, more losses could be on the way — potentially even retesting the recent low.
Particularly when volatility increases, investors need to consider smaller position sizes to account for the wider price swings.
Options
Options investors who are bullish can participate with calls or call spreads. If speculating on the breakout rather than waiting for it to happen first, make sure to use enough time until expiration.
For investors who would rather speculate on resistance holding, they could use puts or put spreads.
To learn more about options, consider visiting the eToro Academy.
Disclaimer:
Please note that due to market volatility, some of the prices may have already been reached and scenarios played out.