The Daily Breakdown takes a closer look at the best-performing sectors since the election — energy and financials.
Friday’s TLDR
- Energy leads the way.
- Financials are a close second.
The Bottom Line + Daily Breakdown
The best performing sectors since the election are — drumroll please 🥁 — energy and financials! These groups are up 8.1% and 7.6% since the election, respectively.
The post-election rally has helped fuel the financial sector to a market-beating return of 33.3% so far this year. Energy has actually lagged the S&P 500 year to date, but the recent rally has helped boost its total return to 17.7% so far this year.
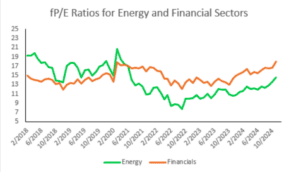
On a valuation basis, both sectors trade with a forward price-to-earnings (fP/E) ratio below the overall market’s fP/E ratio of 22.7x. That’s as energy trades at about 14.5x forward earnings, while financials have an fP/E of 18x.
The flip side of that argument is that comparing those valuations to the groups’ respective prior valuations puts them on the rich end of the spectrum — particularly for financials:

Source: eToro, Bloomberg
Catalysts
The recent catalyst here is obvious: The US election. While some groups have struggled — like healthcare and clean energy stocks — others have done well. However, it doesn’t always play out this way.
For instance, during President-elect Trump’s prior term, clean energy stocks outperformed traditional energy stocks. During President Biden’s term, the opposite has been observed.
Ultimately, investors are hoping for lower regulations and more favorable tax laws to help drive these (and other) groups higher.
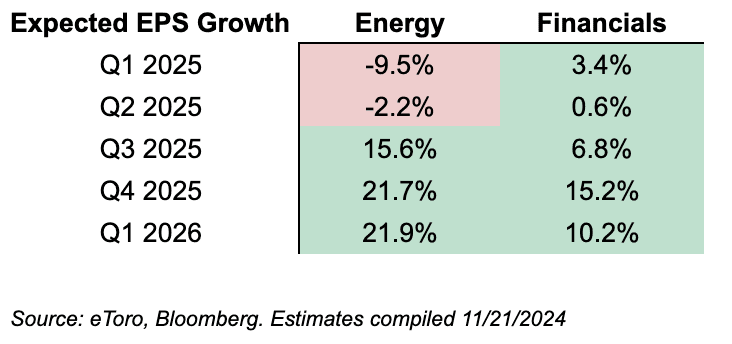
Politics aside, investors will also be focused on growth. Unfortunately, neither sector is forecast to generate strong bottom-line results in Q1 or Q2 of 2025. However, estimates do call for meaningful acceleration in the second half of 2025.

The Bottom Line
At the very least, I thought it would be fun to take a look at which sectors are doing the best since the election, given what a big event it was in 2024. When we look at these sectors, the groups have been trading very well and the technicals are strong.
As it pertains to earnings expectations, keep in mind that these estimates can and do change often — for better and for worse — and that could impact how these groups trade going forward.
Neither of these observations mean that these groups are guaranteed to continue higher. But for me, this is a big part of my initial analysis — looking at the valuations, the expected growth, and the technical setup.
Now, onto the charts…
Want to receive these insights straight to your inbox?
The setup — Energy
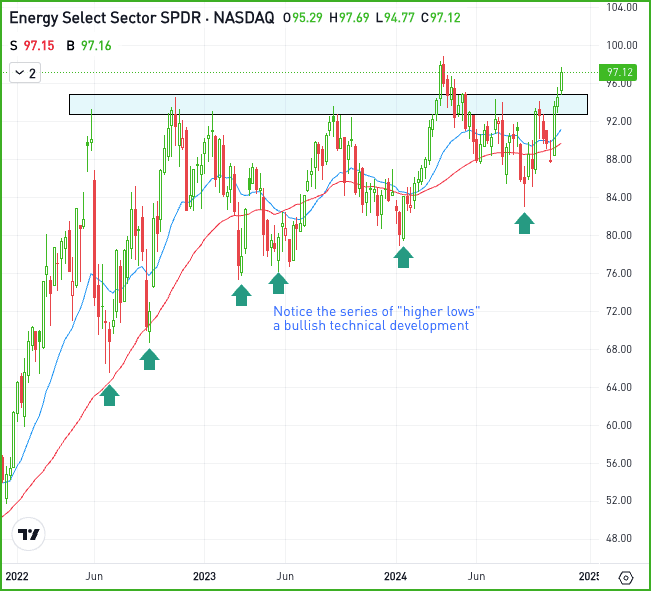
With energy taking a leadership role in recent weeks, I wanted to take a closer look at this group as the XLE ETF has gotten above a key level on the longer term charts.
Notice how much this ETF has struggled with the $93 to $94 zone over the last few years. Now above this zone and bullish momentum has returned.

From here, bulls want to see two things. First, they want to see XLE stay above prior resistance — unlike it was able to do earlier this year. Second, they want to see XLE take out the recent high near $99.
Now, XLE has moved quite a bit in a short period of time, so a pullback could be in order. If that’s the case, prior resistance will be on close watch to see if it acts as support.
Disclaimer:
Please note that due to market volatility, some of the prices may have already been reached and scenarios played out.


