


The Daily Breakdown looks at the long-term returns of the S&P 500, making sense of the pullbacks and putting power back in investors’ hands.
Friday’s TLDR
- Over the long-term, the S&P 500 tends to do quite well.
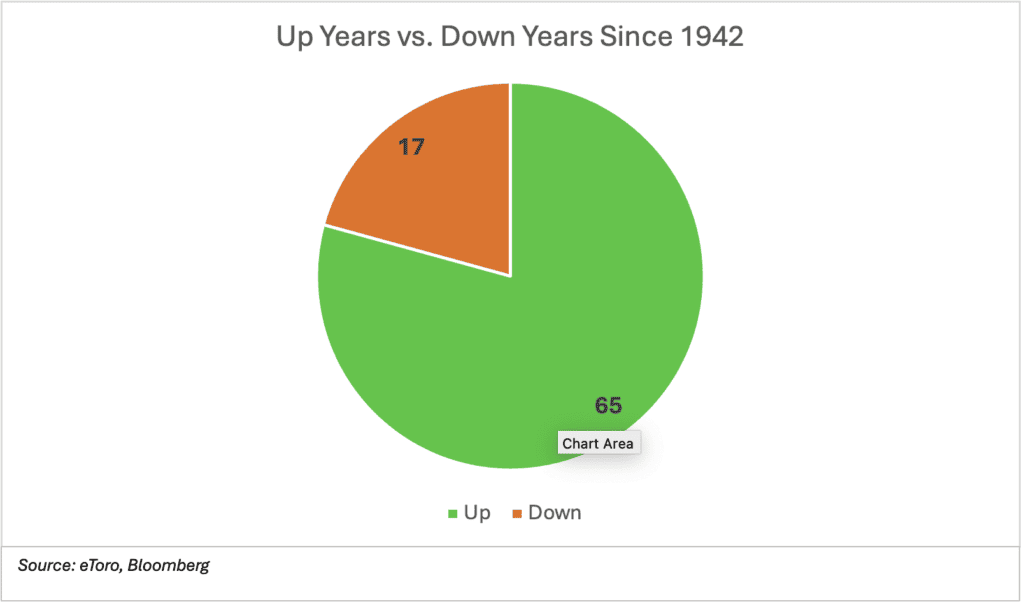
- Up-years outnumber down-years by almost 4-to-1 over the last 82 years.
- Gilead Sciences eyes a potential breakout after earnings.
The Bottom Line + Daily Breakdown
A few weeks ago, I said I would use Friday’s longer format to break down the long-term returns of the stock market. But then we had to cover small caps as the Russell 2000 roared higher by more than 10% in July. That was followed by a huge bout of volatility last week.
So after some delay, let’s discuss the long-term tendencies of the S&P 500, which I think will surprise many of you.
Don’t fall for the “worry traps”
It doesn’t take long to find bad news — even if we aren’t looking for it. There are always issues (both domestically and abroad) and we see these headlines often. However, the stock market does a really good job at deflecting bad news.
Headlines and events can create pullbacks, but they are generally short-lived in the grand scheme of things. Just look at these annual returns of the S&P 500:
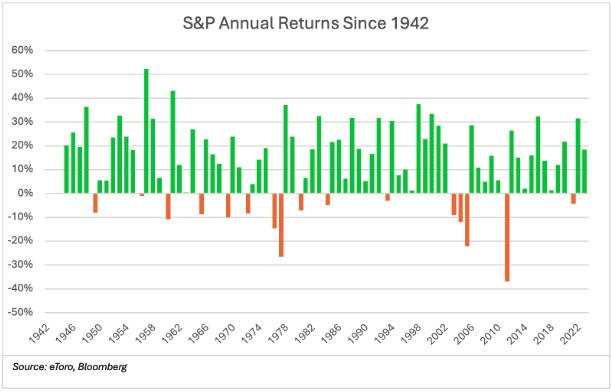
Notice how many more green bars (up years) there are than orange bars (down years)? Rather than count them, let me tell you.
Over the last 82 years, the S&P 500 has generated an annual gain 65 times (or 79% of the time) on a total return basis (which is a fancy way of saying price appreciation plus dividends).
In this span, the average up year had a total return of 19.8%, while the average down year had a total return of -12.1%.
Digging into the data
If the above data seems cherry picked, that’s not the case. Similar observations hold up over different time spans as well. Look at the annual win-rate over the following timeframes based on the criteria above:
- Last 20 years: 81% were up-years.
- Last 30 years: 77% were up-years.
- Last 40 years: ~81% were up-years.
- Last 50 years: ~78% were up-years.
A few other observations stand out, too.
First, since 1942 the S&P 500 has only had one stretch of back-to-back losses (in 1973 and 1974) and one stretch of three straight down years (2000, 2001 and 2002).
However, the index had 12 stretches of three or more consecutive up-years. In fact, the S&P 500 had one streak of eight consecutive annual gains and two streaks of nine consecutive annual gains.
The bottom line
Take comfort in the dips — for they don’t tend to last very long. Sure, the S&P 500 can have a down year or two, but the number of up-years vastly outnumbers the down- years over the last several decades.
Remember, the S&P 500 averages about three corrections a year of 5% or more, while the average intra-year decline is about 14%. The recent dip we just had saw the index fall just shy of 10% (and was our second pullback of the year in excess of 5%).
While that doesn’t necessarily mean we’ve seen the low for 2024, take comfort in knowing that the longer-term trend has historically worked in investors’ favor and should be a consideration in an investor’s long-term financial plan.
Want to receive these insights straight to your inbox?
The setup — GILD
Gilead Sciences has had a tough run. Shares made 52-week highs in January, then unexpectedly fell 10% the next day on bad news. That kickstarted a larger move to the downside, where shares ultimately fell by almost 30%.
But since making a low on May 31, GILD has done quite well. Recently, the stock has had some fundamental momentum as well after beating on earnings and revenue estimates on Aug. 8.
Notice how the stock has regained its key moving averages and is consolidating just below downtrend resistance.
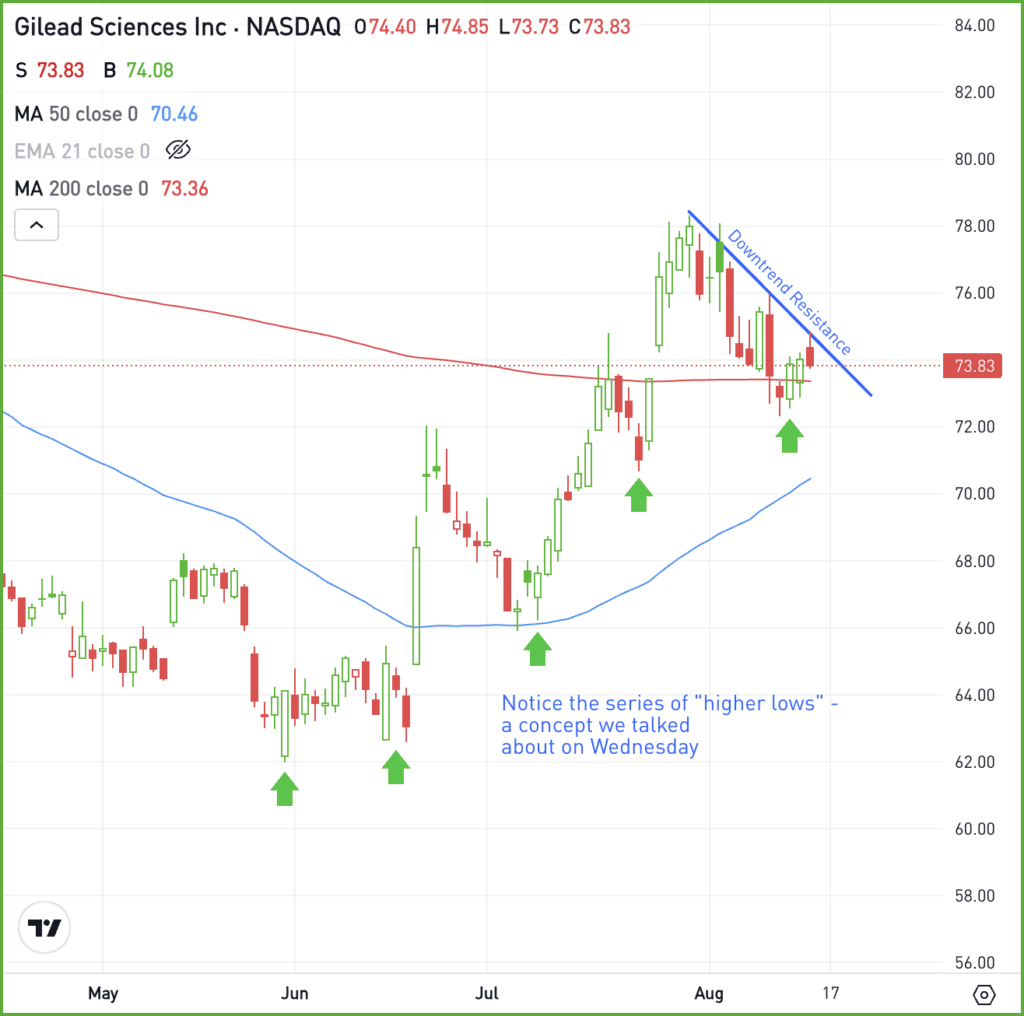
If GILD can break out over downtrend resistance, the recent highs near $78 could be in play, followed by a potentially larger rally. However, if it remains below downtrend resistance and drops below the recent lows near $72, a larger pullback could ensue.
For fundamental investors, note that Gilead pays a 4.2% dividend yield and trades at roughly 12 times the next 12 months of expected earnings.
Options
Investors who believe shares will break out — or those who are waiting for the potential breakout to happen first — can participate with calls or call spreads. If speculating on the breakout rather than waiting for it to happen first, make sure to use enough time until expiration.
For investors who would rather speculate on resistance holding, they could use puts or put spreads.
To learn more about options, consider visiting the eToro Academy.
Disclaimer:
Please note that due to market volatility, some of the prices may have already been reached and scenarios played out.