The Daily Breakdown looks at the week ahead, including the CPI report, the start of earnings season, and an increase in volatility.
Monday’s TLDR
- Volatility jumps as VIX nears two-month high.
- Earnings season unofficially starts Friday.
- Inflation report is on tap this week, too.
What’s happening?
What a way to end the week, as the S&P 500 regained a lot of the ground it lost on Thursday’s 1.2% selloff.
The index rallied 1.1% on Friday, apparently giving a big “thumbs up” to the monthly jobs report. The report saw 303,000 jobs added to the economy in March, coming in well ahead of estimates calling for 214,000 jobs to be added last month.
That’s great news for the economy, which should be investors’ main focus. However, I want you to stay on your toes.
That doesn’t mean sell everything, turn bearish, and buy puts. Not even close — but let’s keep it real.
The S&P 500 is coming off two straight quarters with gains of 10% or more, and last week, we saw a pop in volatility. The VIX — also known as Wall Street’s “fear gauge” — jumped to 16.92, its highest reading in almost two months.
There’s more.
First, the strong jobs report actually increased the odds that the Fed may not cut interest rates in June.
Second, Q1 earnings season kicks off with the banks on Friday. JPMorgan, Citigroup, Wells Fargo, and BlackRock will lead that charge.
Last but not least, we’ll get the monthly inflation report — the CPI report — on Wednesday.
It’s totally possible that these catalysts will help fuel stocks even higher, but all I’m saying is that there’s potential for things to get a little bumpy over the next few days and weeks. Stay on your toes.
Want to receive these insights straight to your inbox?
The setup — XLE
Energy was the best-performing sector in the S&P 500 in Q1. Despite that, many investors are just now realizing how well this group is doing.
At some point though, these stocks will need a break. Perhaps if we get a dip in crude oil prices, energy stocks will dip too. If and when they do, it will be critical to see how these stocks hold up at support.
I’m talking about names that we’ve highlighted over the past month, like Valero, Chevron and ConocoPhillips. But why not look at the whole sector via the XLE?

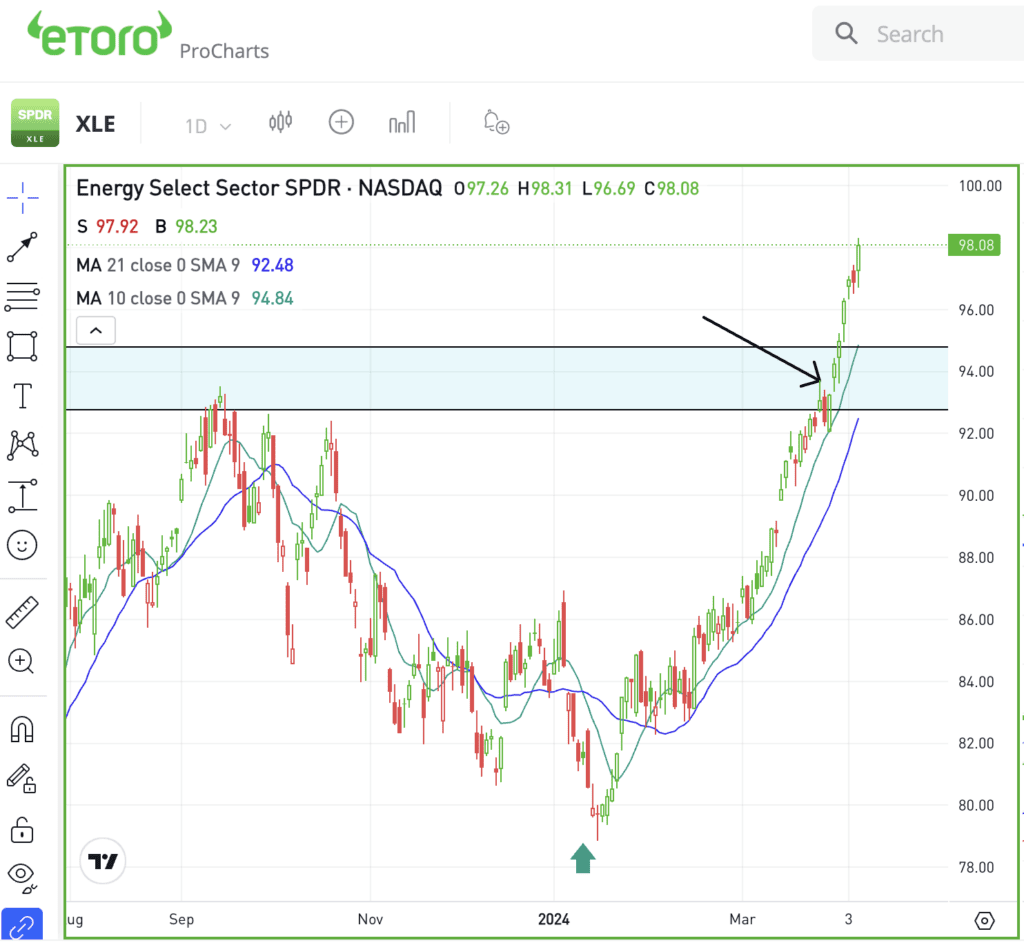
The XLE recently broke out over key resistance, which is shown on the daily chart above. Remember, this resistance zone stretches back almost two years all the way to June 2022.
I want to see how the XLE holds up on a pullback to this zone. It would be even better if a test of this zone lines up with a test of the 10-day or 21-day moving average (both shown on the chart).
If energy stocks are going to remain in an uptrend, bulls will want to see these measures hold as support.
For options traders, calls or bull call spreads could be one way to speculate on support holding on a pullback. In this scenario, buyers of calls or call spreads limit their risk to the price paid for the calls or call spreads, while trying to capitalize on a bounce in the stock.
Conversely, investors who expect support to fail could speculate with puts or put spreads.
For those looking to learn more about options, consider visiting the eToro Academy.
What Wall Street is watching
SPX500 — The S&P 500 is experiencing a bit of volatility, highlighted by a 1.2% drop on Thursday and a 1.1% rally on Friday. It has investors asking questions after a powerful first quarter and ahead of earnings season — especially with the VIX near a two-month high.
TSLA — Shares of Tesla didn’t have a very good week, falling more than 6% and retesting its Q1 low. However, the stock climbed in after-hours trading on Friday after CEO Elon Musk tweeted out, “Tesla Robotaxi unveil on 8/8.”
JNJ — Johnson & Johnson’s acquisition of Shockwave Medical for $13.1 billion propelled the latter’s shares up by nearly 16% last week. Regarding its own shares, J&J stock sank 3.7% last week, hitting its lowest level since November.
Disclaimer:
Please note that due to market volatility, some of the prices may have already been reached and scenarios played out.


