

These days, it isn’t Jay Powell, earnings, or even jobs data driving stock and crypto prices.
Instead, it’s the lines and patterns on charts.
Technical analysis is an investing strategy that involves buying or selling based on how stocks and crypto move relative to how they’ve acted in the past. It’s also one of the most divisive approaches on Wall Street. Some famous investors have sworn by the technicals, while others have mocked them.
We can all agree that fundamentals drive markets over years and decades, but markets have clearly gravitated towards moving averages and momentum indicators in recent days and weeks.
So, let’s get technical.
Moving averages
When people think about technical analysis, they often think about lines drawn on charts.
Enter the 200-day moving average, one of the most important lines to watch. Moving averages are just what they sound like: the average price of a stock over a certain period of time. In theory, the 200-day moving average helps point to a stock’s center of gravity over the last 10 months. Long enough for a reliable trend; short enough to reflect recent price moves.
The S&P 500’s 200-day moving average has proven to be a line in the sand lately. For one, the index has come within 1% of its 200-day moving average in nine of the past 12 trading days. And on Thursday, the index finally closed below the 200-day moving average, breaking a 34-day streak of staying above the trend line.
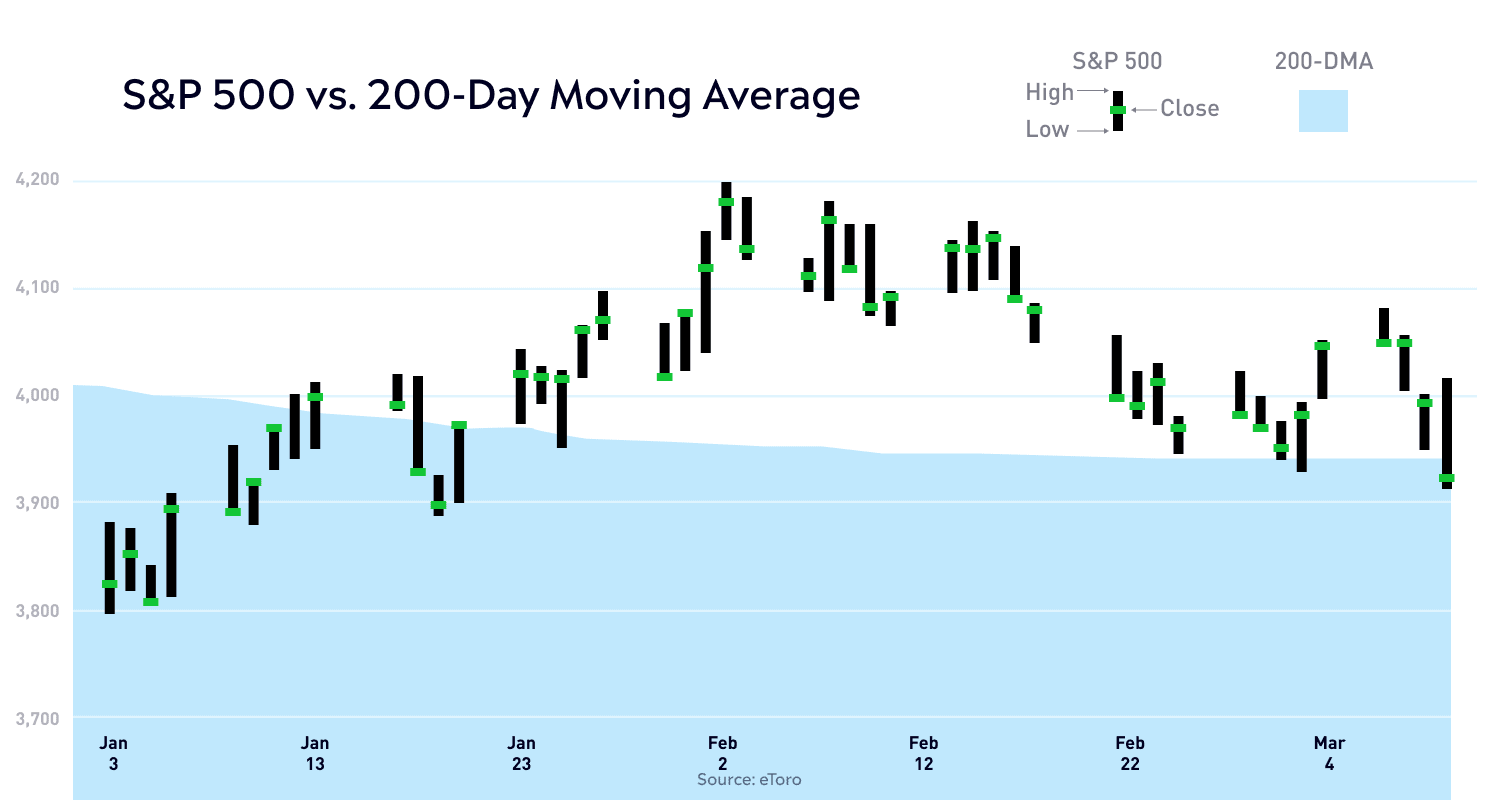
This bear market recovery seems to be in uncharted territory, at least when it comes to this specific indicator. Few bear market rallies since 1950 have been durable enough to make it past the 200-day moving average, meaning that almost every rally above the 200-day moving average has marked the start of a new bull market. Yet, this time around, it doesn’t feel so clear-cut. This latest break below the 200-day could potentially lead to another gut check for prices, simply because this piece of technical support is no longer there.
Stock traders aren’t the only ones watching this moving average, either. Bitcoin went on a tear after crossing its own 200-day moving average, rising 13% in the five days afterwards. 55 days later, and Bitcoin prices haven’t come close to the moving average since.
Ratio analysis
Another way to check technicals is to compare how different assets and investments are performing against each other. When one market goes on a tear while a similarly viewed market sputters out, it’s worth asking why. That’s where ratio analysis comes in.
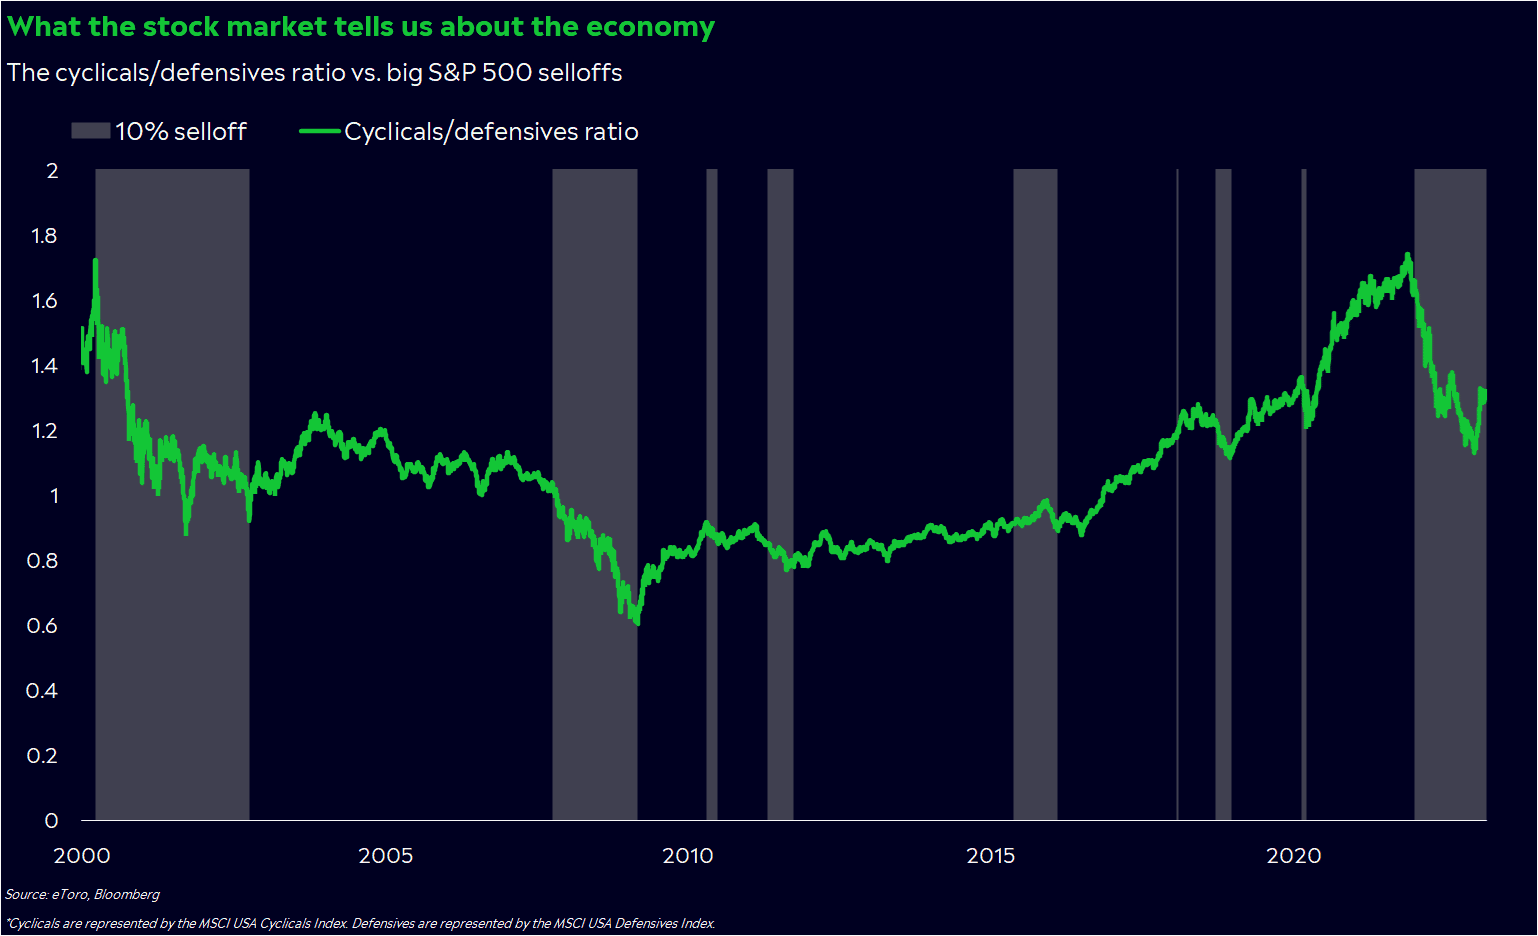
One ratio with an interesting story to tell is the cyclicals/defensives ratio. Cyclical stocks are sectors that tend to do well when the economic outlook looks brighter, while defensive stocks are where people typically hide when there’s trouble on the horizon. Compare them against each other, and you can get a sense of what investors implicitly think about the future through their own investing decisions. As you can imagine, that insight can prove valuable in a time when economists still can’t accurately gauge how strong the economy is.
Over the past few months, the cyclicals/defensives ratio has steadily increased, even though earnings are declining, and worries of systemic instability are resurfacing. Investors have been fretting about the future, yet they haven’t been willing to give up on the economy in their portfolios. Maybe the situation isn’t as bad as we think, and stocks are simply reflecting that.
Now, tech is a cyclical sector, so the increasing ratio could be overwhelmingly due to tech’s recent rally. Regardless, this could be good news for the market if history is any guide. Over the past two decades, we’ve typically seen the cyclicals/defensives ratio dip before more severe selloffs.
Relative strength
Sometimes, the fact that a stock has rallied or dropped too much is signal enough for a technical analyst to buy or sell.
This study is called a relative strength indicator (RSI), and it compares the magnitude of a stock’s recent gains relative to its losses. When an RSI reading comes in above 70, it’s in “overbought” territory and could show that a stock’s price has run too far. Conversely, when an RSI reading comes in below 30, it’s considered “oversold”.
RSI analysis has worked eerily well for some corners of markets this year. Tech has been the strongest sector of the market after a blistering 11% rally in January. But tech’s luck eventually turned, and the Nasdaq 100 peaked on February 2 — the same day its 14-day RSI registered its first overbought reading in 14 months.
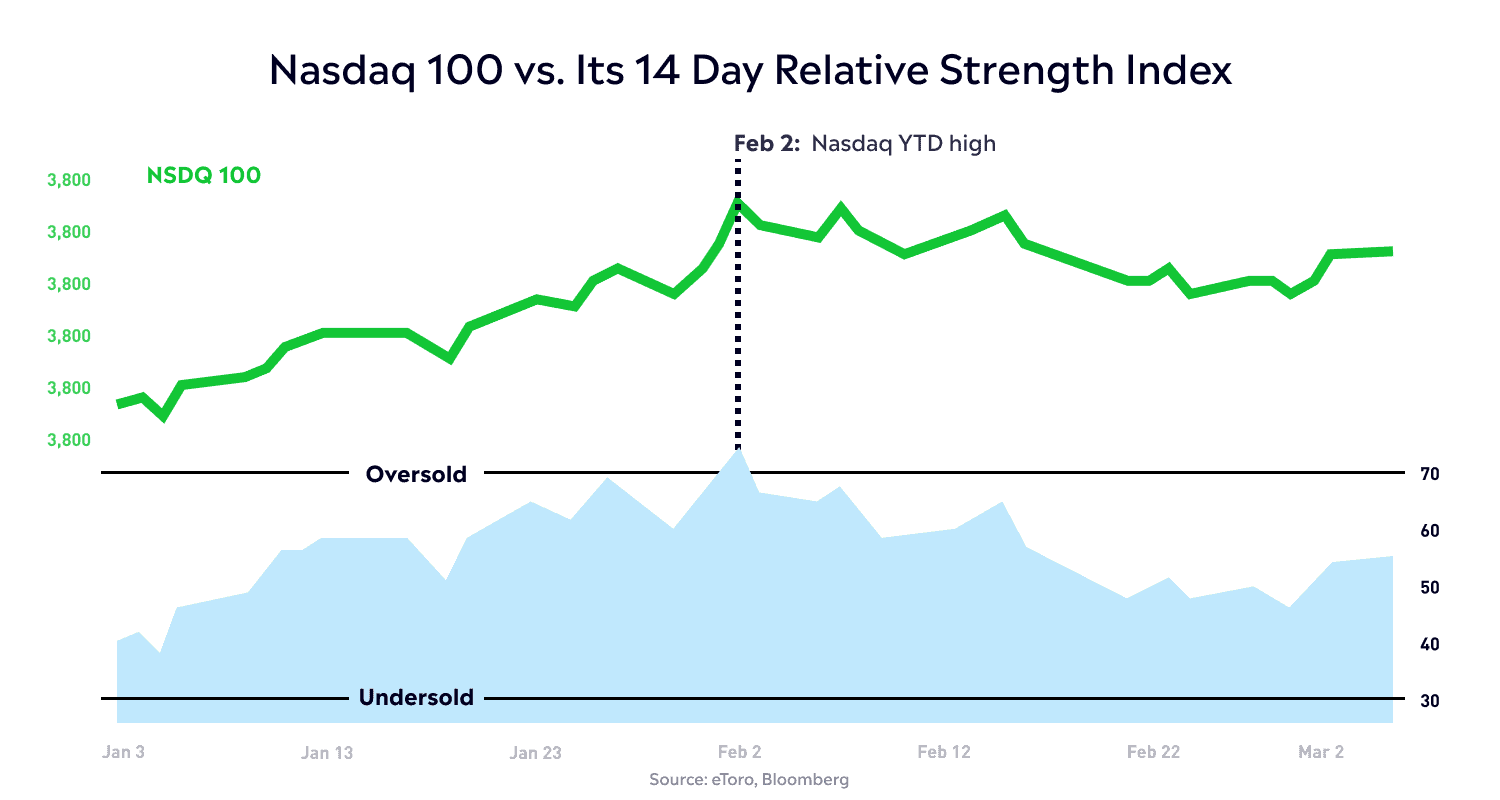
A few other sectors suffered the same fate, too. The S&P 500’s consumer discretionary, real estate, and communications sectors also registered as overbought on February 2, and each proceeded to fall 4% or more over the following week.
It makes sense, if you think about it. When markets are driven by momentum, the technicals that measure momentum become that much more important.
The RSI isn’t foolproof, though. The 14-day RSI for Bitcoin crossed 70 in mid-January, yet the price rallied 30% over 19 days, while the RSI stayed in overbought territory.
Why technicals matter
Technical analysis is just one tool in an investor’s toolbox when evaluating their investments. But in these days of momentum-driven markets, it’s becoming clear that people are viewing technicals as a shroud of certainty in an ocean of conflicting signals. Add in that systematic Wall Street strategies are becoming increasingly popular, and you have a recipe for frantic buying and selling on lines and patterns.
Don’t ignore the fundamentals or throw out your finance textbooks. But even if you’re a long-term investor, you could be tempted to make decisions on short-term market fluctuations. So as you navigate these uncertain markets, stay rational and keep your emotions in check.
By the way, if you want more insights on why technicals matter so much these days, I wrote a piece for the Financial Times on just that. Check it out here.
*Data sourced through Bloomberg. Can be made available upon request.