The Daily Breakdown looks at Tesla’s tumble to 52-week lows ahead of its earnings report this week. AMD is in focus, too.
Tuesday’s TLDR
- Tesla hits new 52-week low.
- Looking at possible support for AMD stock.
- Magnificent Seven earnings are significant to the S&P 500.
What’s happening?
Mega-cap tech stocks are in focus as earnings season heats up, and Tesla will be in focus on Tuesday when it reports after the close.
While Netflix reported earnings last week, Tesla is the first of several big earnings reports from the Magnificent Seven this week. It’s also one of several automakers reporting their results — including Ford and General Motors.
Unfortunately, it hasn’t been a smooth ride for Tesla.
Shares have now fallen for seven straight sessions, declining 18.6% in that span. The stock is down 42.8% year to date, 14% over the past year, and 65.6% from its all-time high.
Earnings will be a big deal — not just for Tesla but for the market as a whole.
According to FactSet, “Five of the seven companies in the ‘Magnificent 7’ are projected to be the top five contributors to year-over-year earnings growth for the S&P 500 for Q1 2024.”
Excluding those five companies, analysts expect S&P 500 earnings for the remaining 495 firms to fall 6% year over year for Q1.
On the bright side, earnings for the S&P 500 are expected to accelerate throughout the year. Further, bulls are hopeful that earnings can help the markets recover some of the recent losses amid the current pullback.
Want to receive these insights straight to your inbox?
The setup — AMD
Chip stocks have been getting hit hard lately, with Nvidia, Advanced Micro Devices and others tumbling last week. In fact, AMD fell more than 10% last week — its third straight weekly decline.
Shares are now down about 35% from the intraday all-time high of $227.30 made on March 8. Chip stocks like AMD went from all the rage in Q1 to a wet blanket in Q2.
Will these stocks firm up and rebound higher or will they dip further from here?
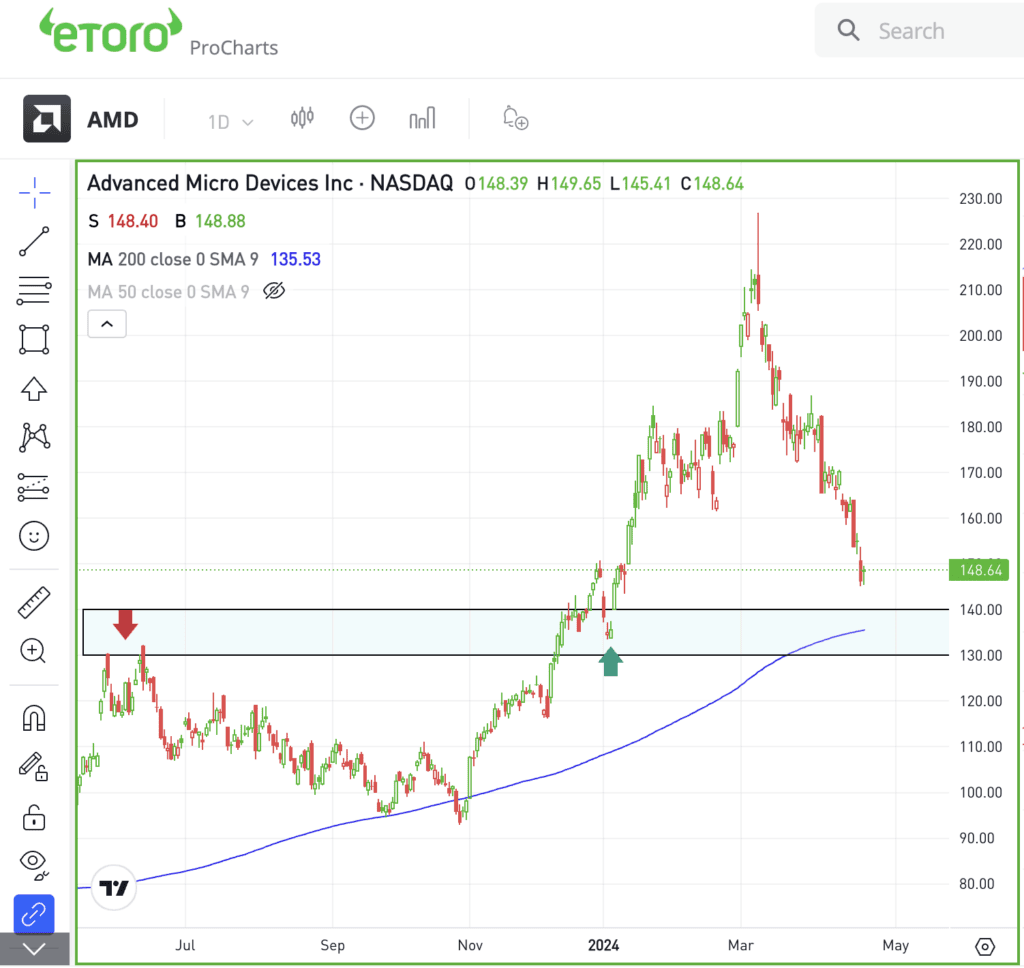
For AMD, I am keeping a close on the $130 to $140 area. While that’s admittedly a wide $10 range, it appears notable on the daily chart below.

That’s as this level was resistance last summer, but then support at the beginning of the year following AMD’s breakout in late December. Now dipping back toward this zone, active investors will want to see if this area acts as support again.
Further, this zone also contains the 200-day moving average, a long-term technical indicator that measures the long-term trend.
For these reasons, investors are looking for possible support in this area. If support doesn’t come to fruition, lower prices may be in order.
Disclaimer:
Please note that due to market volatility, some of the prices may have already been reached and scenarios played out.


