


Crypto investors believe April 2024 will be an especially important month. Why? The four-year cycle of Bitcoin halving.
Here’s how it works: In the past, Bitcoin has moved in four-year patterns around macroeconomic factors and Bitcoin’s “Halving” — an event in which Bitcoin’s supply issuance is cut in half. With the next halving set to take place in April 2024, let’s take a look at a few metrics to illustrate how closely this current cycle is tracking previous ones.
The reassurance of no surprises
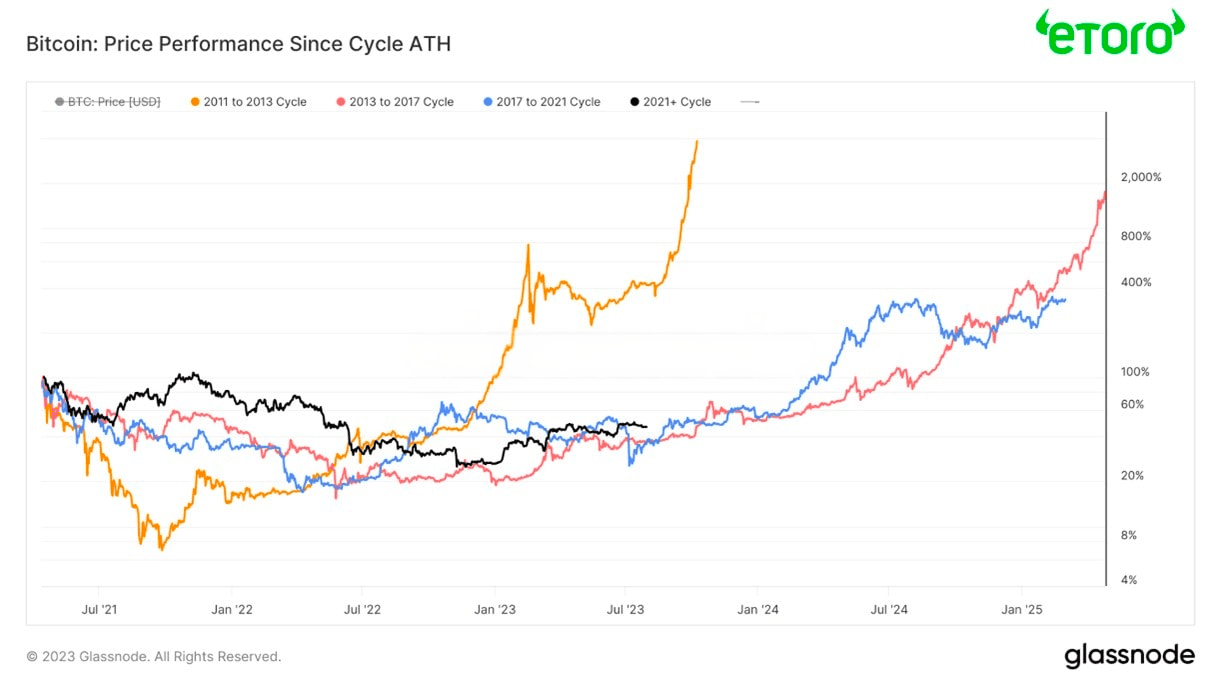
Looking at price performance alone, this current cycle (shown in the chart below in black) appears to be tracking quite closely with previous market cycles.
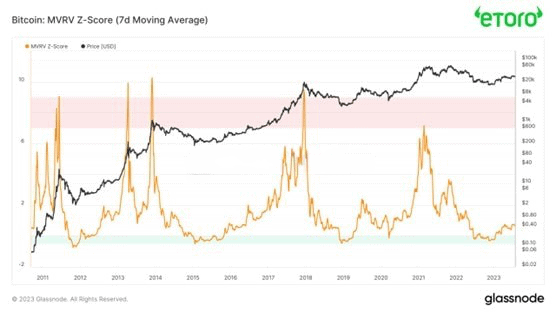
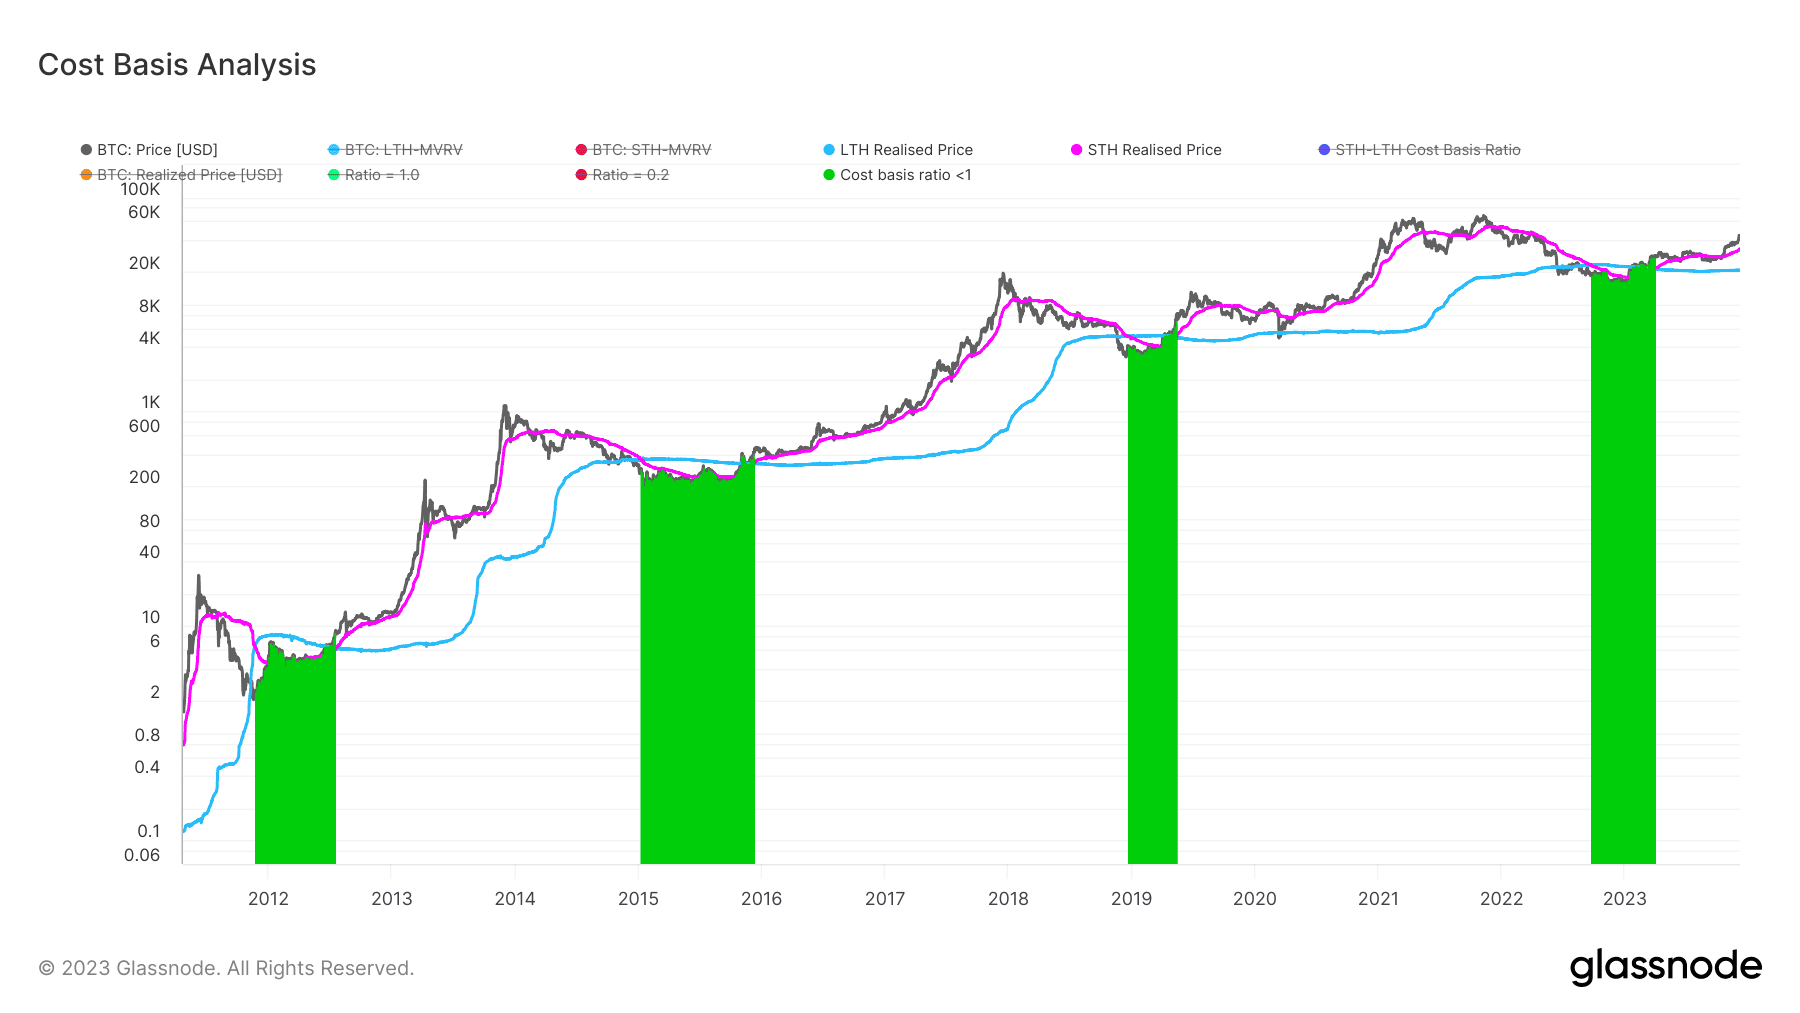
One of the most reliable valuation models for Bitcoin is the market value to realized value ratio. This compares realized value, which is the aggregated cost basis of the Bitcoin network based on the price that coins were last moved, relative to the current trading price. Whenever the current marginal trading price of Bitcoin vastly overshoots the aggregated cost basis of the network, there is a high likelihood that market participants will look to take profits (red zone).
On the flip side, whenever the current marginal trading price is below the aggregated cost basis, by definition the market is underwater. Historically, this has proven to be a prudent time to accumulate Bitcoin (green zone).
After spending several months below the aggregated cost basis of the network, Bitcoin now appears to be pushing out of a region of “deep value,” although it’s still in the lower bounds of historical valuation.
But this is just the beginning. Should we be optimistic or pessimistic about Bitcoin’s future? If someone gives you a one-word answer to that question — then beware. Instead, we have to jump further into the weeds to gain some insight. Here’s what you should look at:
1. Momentum indicators
Short-term holders’ cost basis has historically served as a high time frame momentum indicator, serving as support in bull markets and resistance in bear markets. In addition, whenever long-term holders’ cost basis is below short-term holders’ cost basis, it has historically marked prudent opportunities to accumulate Bitcoin on a multi-year timeframe.
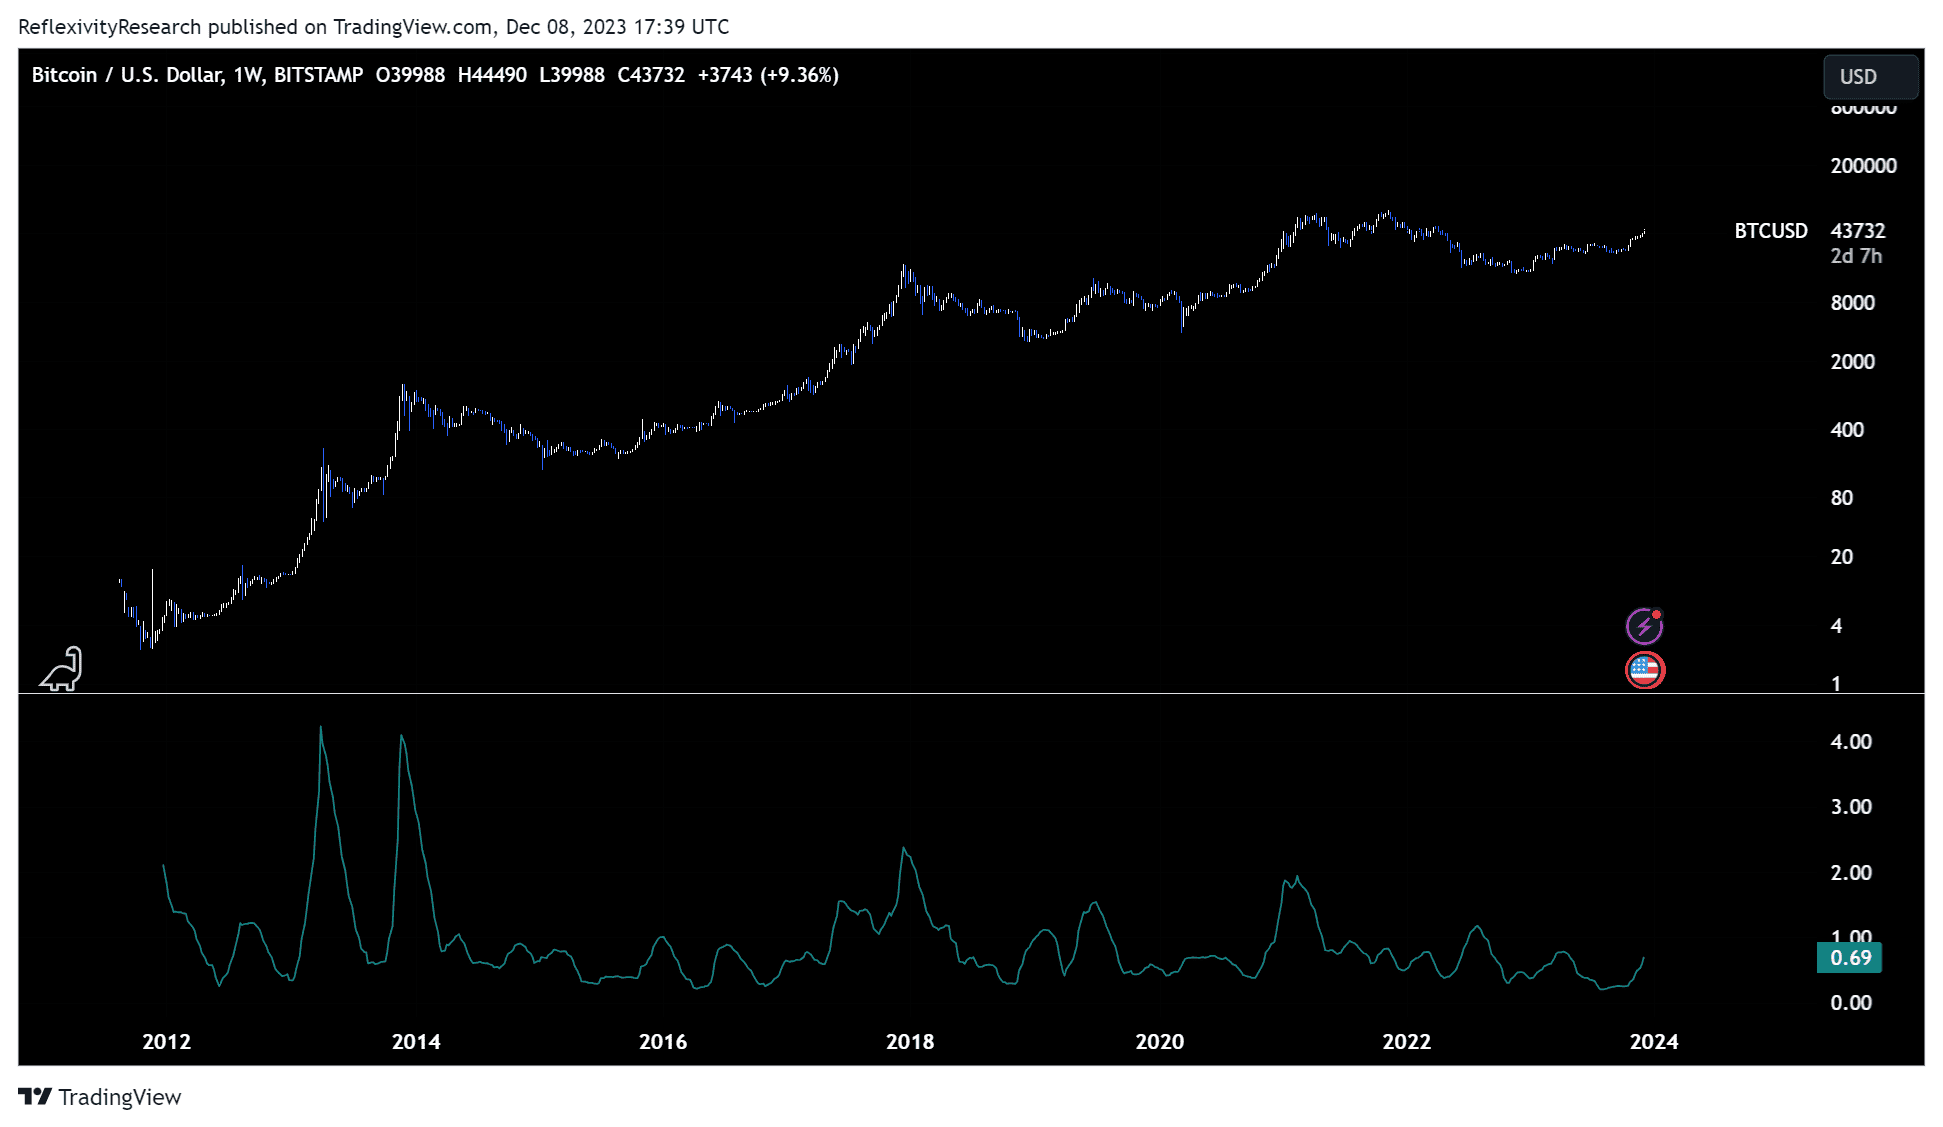
2. Waning volatility
While we finally got a spike in volatility in mid-August, implied and realized volatility almost fully retraced since then. One way to illustrate this is by looking at Bollinger bands, which represent how tight volatility has become and where price is trading relative to recent price history. Currently, the width of Bitcoin’s weekly Bollinger bands is about the tightest that it has ever been on record.
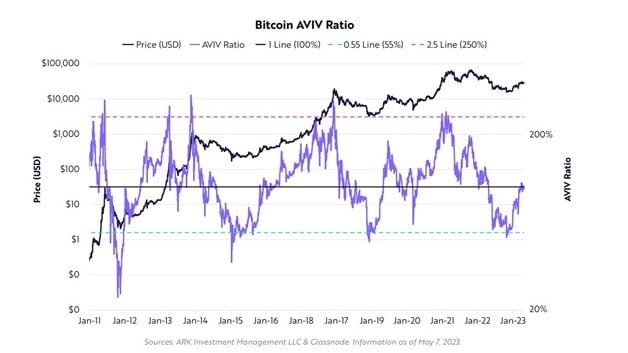
3. The AVIV ratio — valuing Bitcoin
One valuation metric that we have not yet discussed is the AVIV ratio. Recently published by Ark Invest and Glassnode, this compares the active capitalization of Bitcoin to its investor capitalization.
In simple terms, this represents the amount of active supply relative to the amount of supply held by investors. Spending roughly 50% above and below a value of 1, the mid-point of this ratio serves as the true mean of the Bitcoin network.
4. Supply distribution – another positive trend
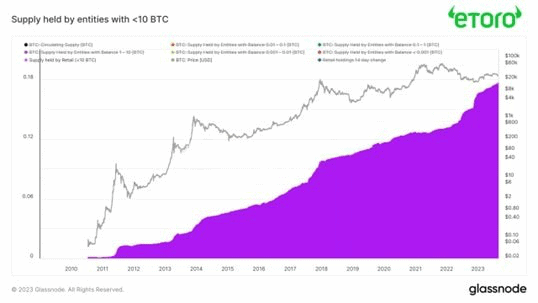
To wrap things up with some fundamental data, the percentage of Bitcoin’s supply held by entities with less than 10 Bitcoin continues to push to new highs, representing a continued positive trend in Bitcoin’s supply distribution over time.
Beyond technical analysis, it’s also important to look at sentiment around Bitcoin — in groups ranging from short-term traders to the general public.
What are short-term traders feeling?
While we saw short term holder cost basis reclaim that of long-term holders back in March 2023, which likely signals the multi-year lows may be in. Now, Bitcoin is above both the long-term and short-term holder cost basis.
What about long-term holders?
When we look at long-term holders, not only has the percentage of supply held by this cohort breached 75%, but the amount of supply that hasn’t been moved in at least a year is at all-time highs. This shows that despite the short-term price decline, longer-term market participants are unshaken.
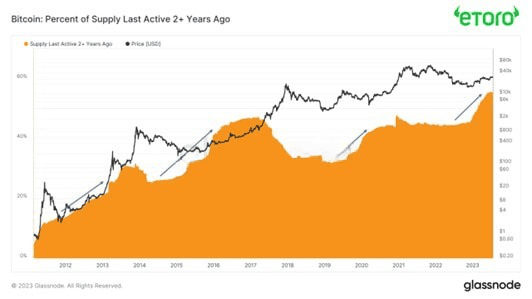
Plus, the amount of Bitcoin supply that has not moved in at least two years continues to reach new all-time highs. This reflects the strong belief of current BTC holders in the crypto asset, despite market-wide contagion throughout 2022 and a ton of headwinds in the macroeconomic landscape during the same time period.
Remember, markets are based on supply and demand — and Bitcoin is no different. If demand outpaces supply, the asset price usually increases.
How about miners?
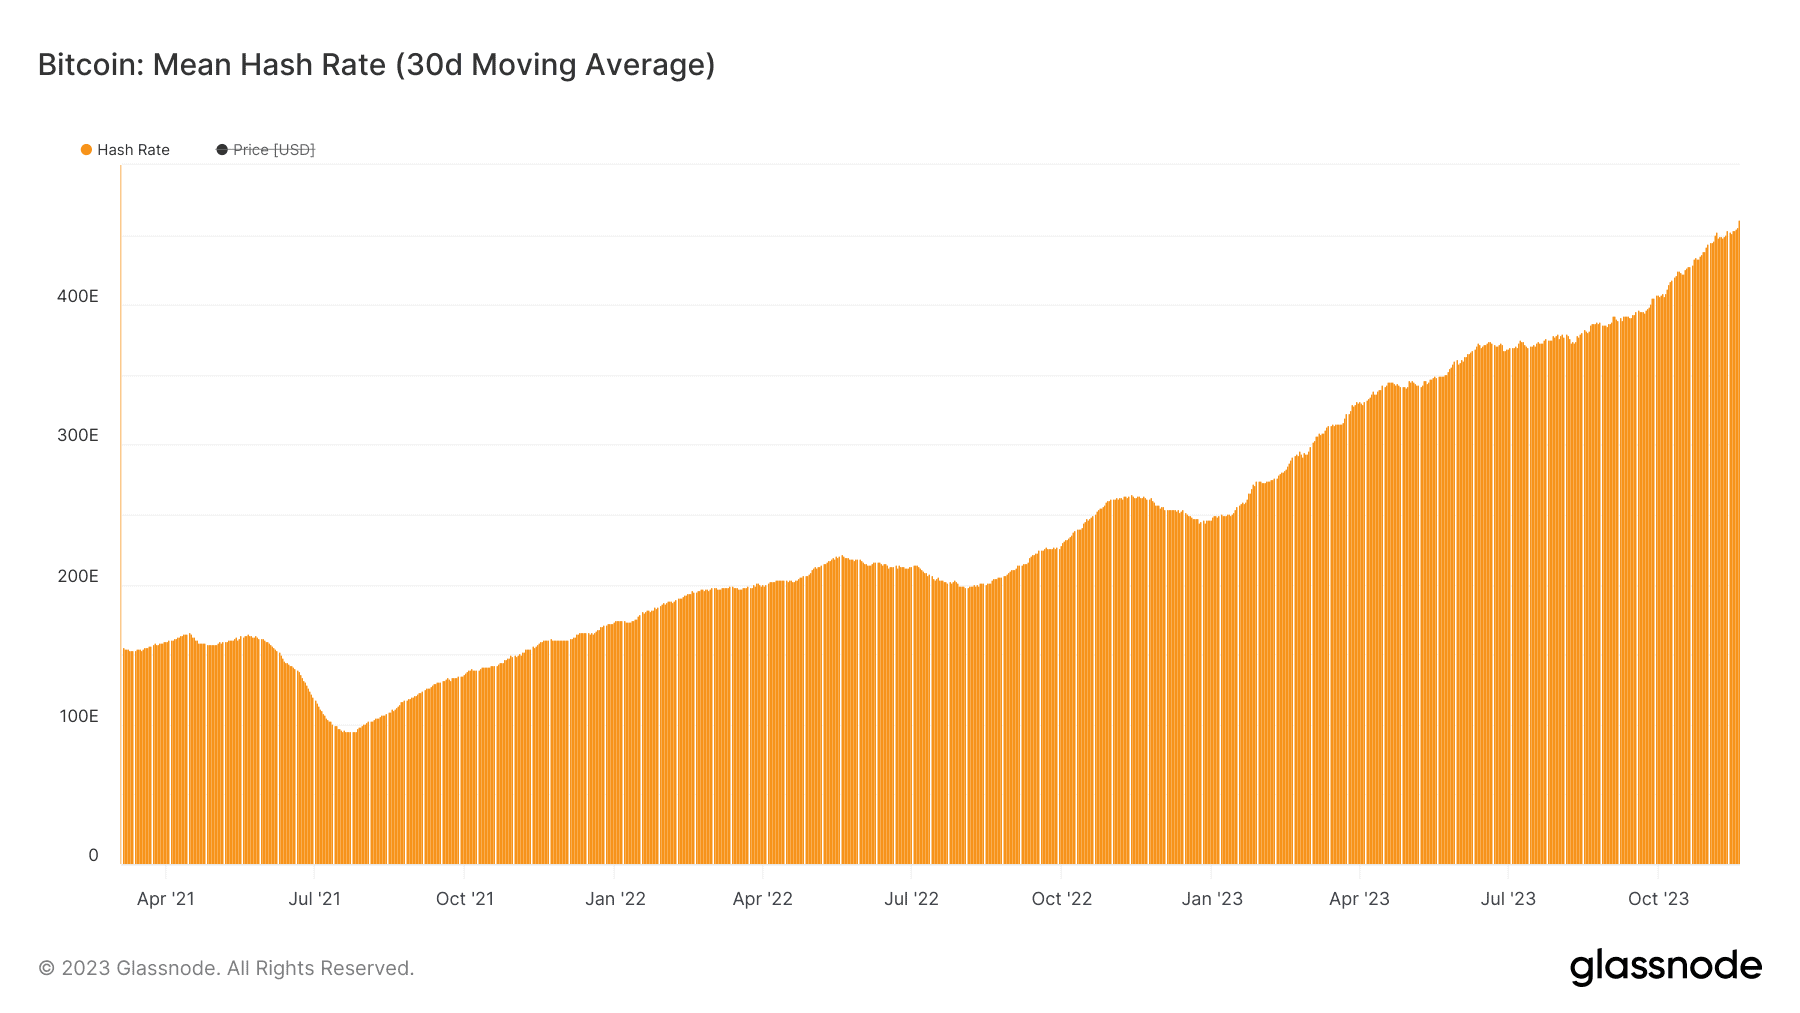
Looking at other fundamental metrics to gauge the health of the Bitcoin network, we can see that Bitcoin’s hash rate has just set another all-time high, indicating increasing demand to mine the leading digital asset as well as more efficient mining rigs being plugged in.
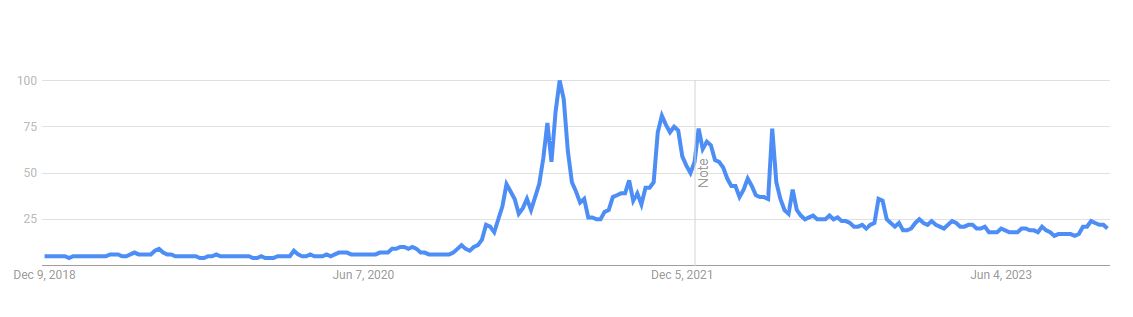
And finally, what about the public?
Google searches for crypto are at multi-year lows, retracing the entire 2020-2021 bull market. This is important! It reflects declining interest in the space, which could mark a major opportunity for those who have stuck around this long and hold belief in the asset class. As Warren Buffett says, “It is often prudent to be fearful when others are greedy, and greedy when others are fearful.”
Why this all matters
Technical analysis and overall sentiment can be great tools to help you decide if you want to invest — but it’s important to remember why we’re discussing this all now. The answer is complex — just like a lot of the sentiment around Bitcoin, but it has to do with the importance of the Halving.
First of all, we can see a clear pattern around Bitcoin’s price performance broken down by year to date. Bitcoin’s down years have all come two years after the halving (2014, 2018, 2022). However, the year before the halving, the year of the halving, and the year after the halving have all been positive. The year after the halving has been the best-performing set of years on average.
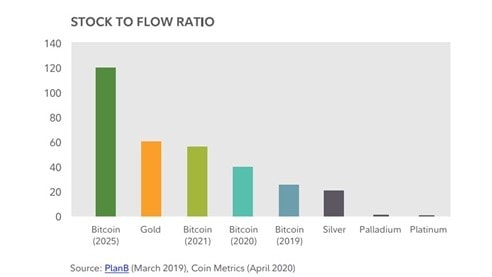
Second, the upcoming Bitcoin halving marks a pivotal moment for Bitcoin from a scarcity standpoint.
The halving will cause Bitcoin’s stock-to-flow ratio, which is a comparison of an asset’s supply issuance relative to its current circulating supply, to surpass that of gold. This reflects just how scarce Bitcoin is becoming as a decentralized alternative to gold. This chart below from a Fidelity report on Bitcoin shows how Bitcoin will be superior to gold on a stock-to-flow basis after its upcoming halving.
Essentially, there is a high likelihood that the halving will have a major impact on the crypto market. If you don’t want to miss out, you should start considering if Bitcoin is right for your portfolio.
The material in this blog post was created exclusively for eToro by Reflexivity Research.
This communication is for information and education purposes only and should not be taken as investment advice, a personal recommendation, or an offer of, or solicitation to buy or sell, any financial instruments. This material has been prepared without taking into account any particular recipient’s investment objectives or financial situation, and has not been prepared in accordance with the legal and regulatory requirements to promote independent research. Any references to past or future performance of a financial instrument, index or a packaged investment product are not, and should not be taken as, a reliable indicator of future results. eToro makes no representation and assumes no liability as to the accuracy or completeness of the content of this publication.