
Many people are quick to get into online trading, especially on a platform that is as easy to use as eToro. Yet, some could find the technical aspects quite daunting. Technical analysis in financial markets is something worth taking the time to learn. It is the tool most used by most professional traders.
We want to make sure your entry into the realm of technical analysis is a smooth one. So, we’ve created a glossary of terms that will help you in familiarising yourself with the field:
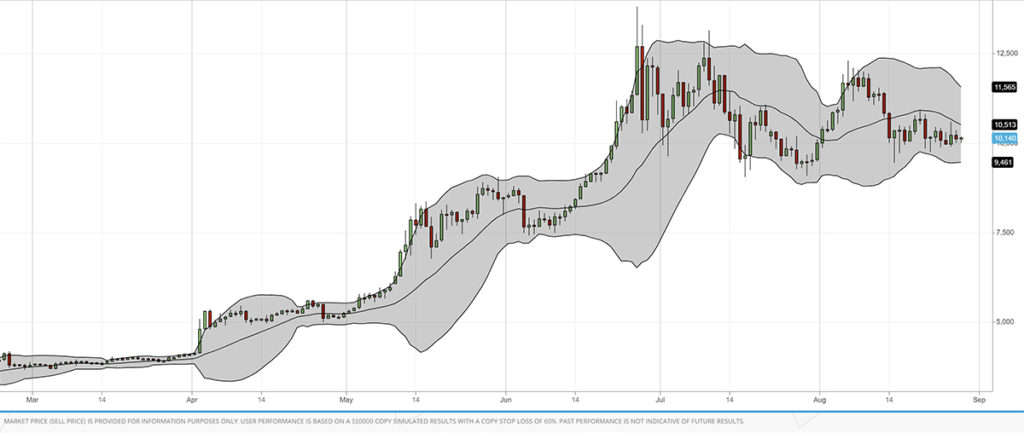
Bollinger Bands
Bollinger Bands are a popular indicator used by traders. These bands use a 20-day moving average as a central line. Above and below the line are two tracing bands in standard deviation width. The lines act as an exponential moving average. Traders use the bands to detect the strength of a trend and time market entries. Bollinger Bands change with the increase or decrease in volatility. The bands will expand as the price fluctuates and contract when volatility decreases. Bollinger Bands can detect if an asset is overbought or oversold. If the price of the asset goes outside their bounds, traders consider it overbought. If it remains below the lower band, the asset is considered oversold.
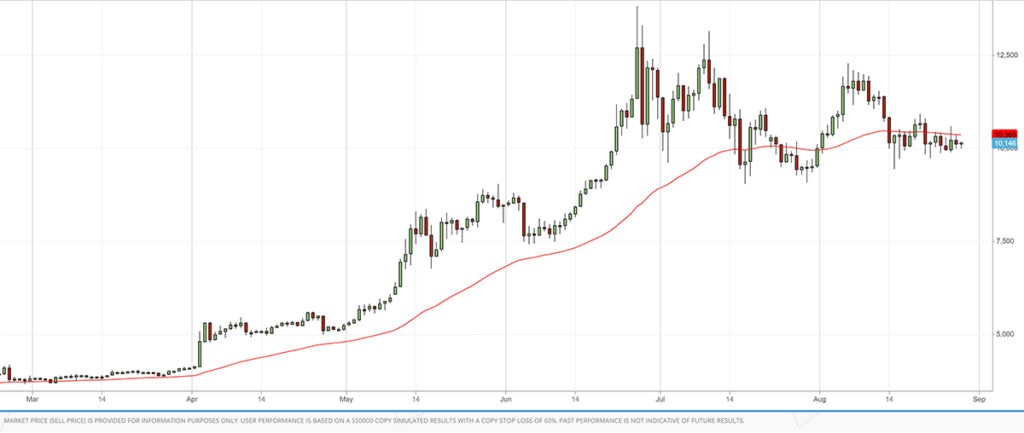
EMA (Exponential Moving Average)
EMAs are a basic type of moving average indicators. They measure trend direction over a period of time. EMA gives more weight, or importance, to recent data rather than historical data. SMA (simple moving average) gives equal weight to all the values. Analysts use EMAs as a technical analysis tool in conjunction with other indicators. This confirms significant market moves and gauges their validity.
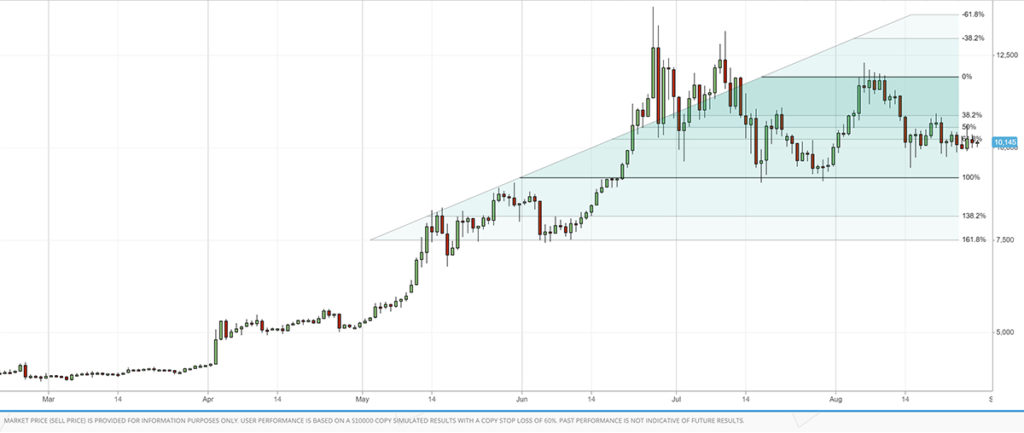
Fibonacci (Retracements)
The Fibonacci retracement tool is a popular technique. Traders use it for technical analysis of stocks, to help predict how high or low a stock’s price will go. Traders will take two extreme points – high and low – on a chart. Then, they divide the distance by the Fibonacci ratios, 23.6%, 38.2%, 50%, 61.8% and 100%. This helps to discover the vital points where an asset’s price reverses. These numbers are based on the Fibonacci sequence of numbers (1,1,2,3,5,8,13,21, etc.), hence the title given to this indicator. According to this technique, the direction of a past trend is likely to resume once the price has retraced to one of the ratio numbers.
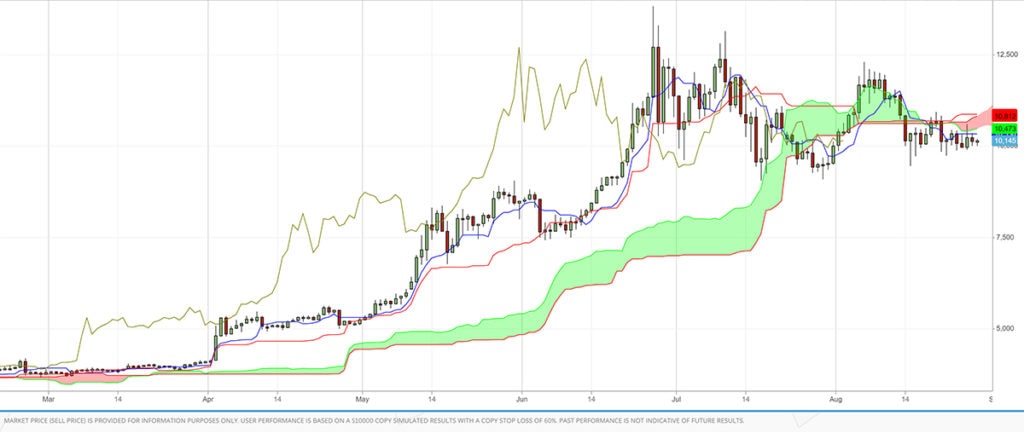
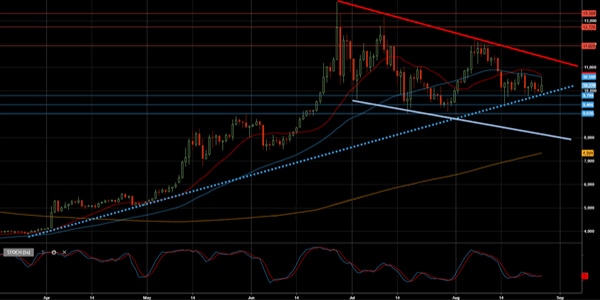
Ichimoku Clouds
Ichimoku Clouds are indicator charts used to display Support and Resistance details. They also show stock momentum and trends, all in one screen. If the current price appears above the cloud, the direction of the stock is going up. If the current stock price appears below the cloud, it is in Or, if the colour of the cloud is green, the market is “bullish.” If the colour of the cloud is red, the market is “bearish.” The cloud lines can also be translated as levels of support and resistance. Ichimoku Clouds go further than the current price action. They project roughly a month ahead of the current stock price. You can read more here.
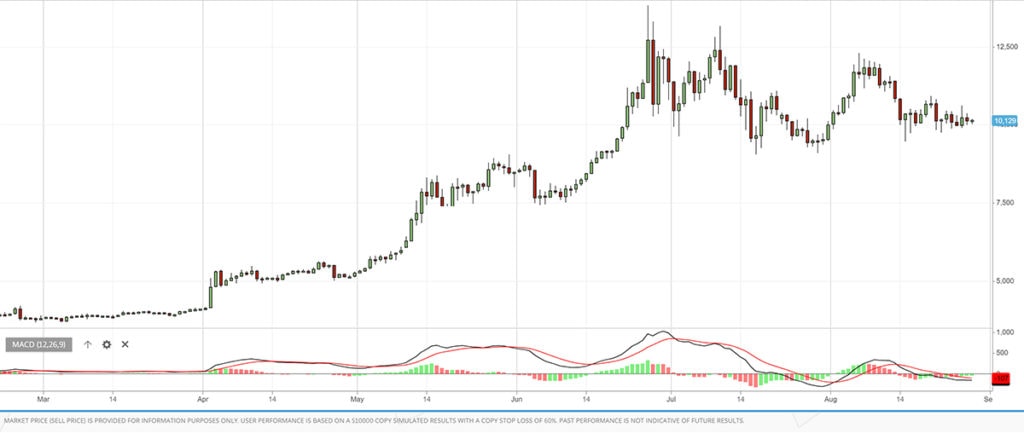
MACD (Moving Average Convergence Divergence)
Analysts use MACD for technical analysis of stocks. It is an oscillator momentum indicator. MACD helps traders identify trends, directions, momentum and strength in the stock market. It’s also used to confirm trends based on other strategies, with its own unique trade signals. The MACD is composed of two moving averages: a 12-day average, and a 26-day average. The MACD line moves faster than the signal line, since the latter is a moving average of the MACD line. The MACD also consists of a histogram that fluctuates above and below zero. The histogram displays the extent that the MACD has reached above or below the signal line. Also, it provides a short-term view of recent momentum and directional change. When the histogram is above zero, recent momentum was higher. Below zero, recent momentum was down.
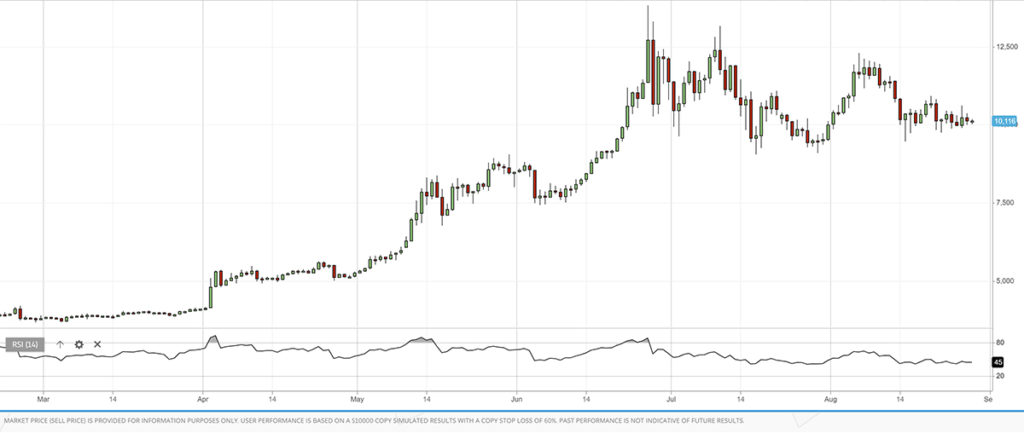
RSI (Relative Strength Index)
The Relative Strength Index is a momentum indicator. It measures a stock’s relative strength against its price history. The RSI fluctuates between 0-100, and records the stock’s price over a certain time frame. It records increases and decreases in the stock price on the RSI graph. If an asset’s price value falls below 30, it is considered oversold. If it climbs over 70, it is considered overbought. By using RSI, a trader can determine a stock’s profit or loss over a period of time. You can read more about RSI here.
Experiment With Technical Analysis
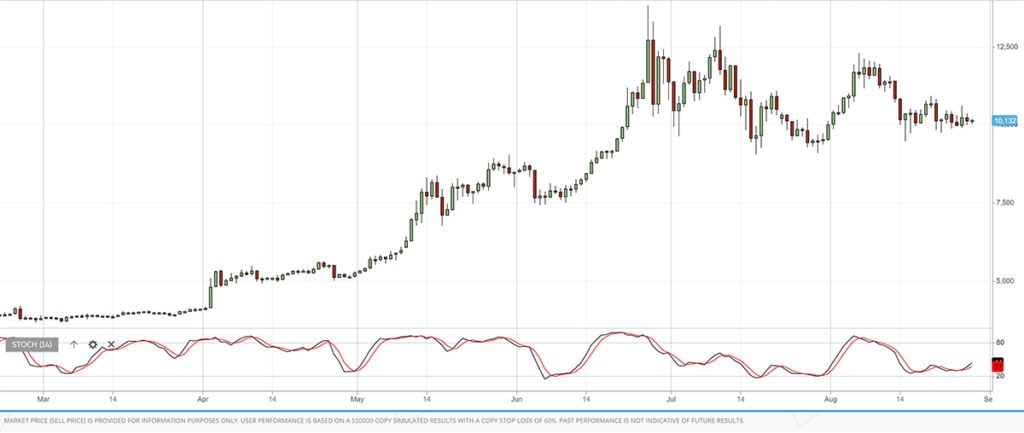
Stoch RSI (Stochastics Indicator)
Stoch RSI is a popular oscillator indicator. Chande & Krollcreated it in the book, The New Technical Trader. The aim of this indicator is to create more overbought and oversold signals than the Relative Strength indicator. Stoch RSI employs RSI values instead of traditional price values. It measures where RSI’s present value stands, relative to its high or low points, for a specific period. Since it fluctuates between 0-100, it is also referred to as an oscillator. Stoch RSI works by providing traders with overbought and oversold signals. It generates buy signals when Stoch RSI shifts from oversold (under 20) to above 20. It forms sell signals when Stoch RSI declines from overbought (above 80) to below 80. A financial asset can remain within either the oversold or overbought zone for an indefinite amount of time.
Support and Resistance
Support and resistance are the most used tool for technical analysis. They represent key points for investors on when to open or close a trade. They represent “invisible thresholds”, where the investor believes the price will not dip further (support) or does not climb higher (resistance). The support level is where demand for the stock is firm enough to prevent the price from dropping. The logic behind it is simple. As the price decreases towards the support line, it will interest more traders. At the same time, sellers will resist selling. When reaching the support line, high demand would prevent the price from dropping further. When prices break the support line, this indicates that buyers are still not willing to buy at that price. At the same time, sellers are willing to sell at an even lower price. Resistance levels are a so-called “ceiling” that prevents prices from rising higher.
The world of trading and investing is vast and the lingo used by traders is quite extensive. The above glossary should give you a great starting point to join the conversation. With it, you can gain a better understanding and start performing technical analysis. To experiment with technical analysis, open a free account with eToro. You can use the virtual account to practise the different techniques.
Get a FREE Virtual Account to Practise Trading
CFDs are complex instruments and come with a high risk of losing money rapidly due to leverage. 62% of retail investor accounts lose money when trading CFDs with this provider. You should consider whether you understand how CFDs work, and whether you can afford to take the high risk of losing your money.